
This week’s ai stock spotlight is TJX Companies ($TJX)
Let’s talk about one of the most compelling, and perhaps underappreciated, retail stories in the market: The TJX Companies, Inc., ticker symbol $TJX.
$TJX is the behemoth behind brands like T.J. Maxx, Marshalls, HomeGoods, Sierra, and Homesense. They’ve become synonymous with what retail insiders call the “off-price” business model — selling brand-name apparel, home décor, and footwear at prices well below traditional department stores. What makes $TJX so effective isn’t just the merchandise — it’s the psychology. They’ve turned shopping into a treasure hunt, a game of scarcity and discovery that keeps customers coming back for more.
Headquartered in Framingham, Massachusetts, $TJX has scaled its operations far beyond the U.S. borders. The company operates in nine countries, including Canada, the U.K., Ireland, Germany, Poland, Austria, the Netherlands, and Australia. This kind of global footprint is rare for a discount retailer, and it speaks to the scalability of their model.
Founded in 1976 as a subsidiary of Zayre Corp. and later spun off in 1987, $TJX has evolved from a domestic discount retailer into a global player. Much of the original vision was driven by Bernard Cammarata, who saw a retail niche that others missed: quality brands, priced to move, presented with just enough unpredictability to spark shopper excitement.
Revenue comes from volume — and velocity. $TJX buys up excess inventory from upscale retailers and brands, often at steep discounts, and flips that inventory quickly, turning over merchandise faster than many of their full-price competitors. What’s more, they don’t rely on markdowns or coupons. They offer a straightforward value proposition — what you see is already a deal.
The key revenue engine? Their U.S. segment, particularly the T.J. Maxx and Marshalls stores. Combined, these chains account for more than 60 percent of total sales. HomeGoods follows closely behind as the second major contributor. While their international businesses are expanding, the U.S. still provides most of their cash flow and earnings power.
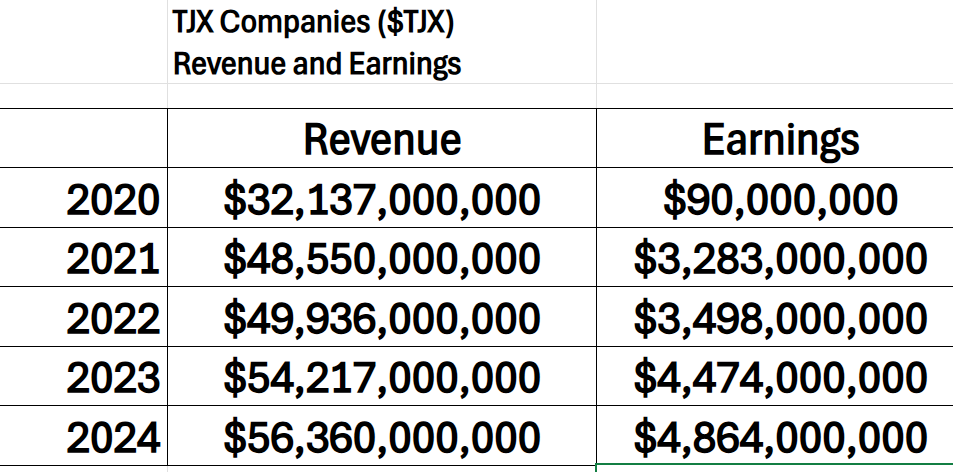
In the first half of fiscal 2025, $TJX Companies reported strong performance, with Q1 net sales rising 6% year-over-year to $12.5 billion and Q2 sales increasing 6% to $13.5 billion. Comparable store sales grew 3% in Q1 and 4% in Q2, driven entirely by increased customer transactions. Net income for both quarters reached $1.1 billion, with Q1 EPS at $0.93 (up 22% year-over-year) and Q2 EPS at $0.96 (up 13%).
$TJX returned significant capital to shareholders, distributing $886 million in Q1 and $982 million in Q2 through share repurchases and dividends. The company also opened its 5,000th store and invested approximately $360 million in a 35% stake in Brands For Less, expanding its international presence.
Challenges include economic headwinds in Europe, particularly in the UK, and rising wage and freight costs that may pressure margins. However, opportunities lie in strong vendor relationships, effective inventory management, and strategic global investments, positioning $TJX for continued growth.
When we study their revenue and earnings over the last 5 years, we can clearly see that both have grown in a very stable manner considering everything that has occurred in the world.
As of 2025, $TJX operates more than 5,000 stores globally. That includes approximately 2,900 T.J. Maxx and Marshalls locations in the U.S., about 900 HomeGoods stores, and hundreds more abroad. Their ability to grow store count while maintaining margin discipline is notable, particularly in an era where many brick-and-mortar retailers are scaling back.
And then there’s their market cap — roughly $115 billion. That places $TJX firmly in mega-cap territory, right alongside the biggest names in retail. It’s a company that has proven remarkably resilient, outperforming during economic downturns and thriving in the face of supply chain volatility, inflationary pressure, and changing consumer habits.
$TJX is a finely tuned operation that sits at the intersection of consumer behavior, supply chain inefficiency, and margin optimization. And in a world increasingly shaped by price sensitivity, it just might be one of the smartest businesses in retail.
While most retailers are tripping over themselves in this economic minefield, $TJX has been cool, calculated, and cash heavy. They didn’t just weather the recent market chaos — they profited from it. Shoppers are hunting for deals, and $TJX is the sniper on the hill picking off high-quality inventory and flipping it fast. Last quarter? They slammed it out of the park — $16 billion in revenue and earnings per share that beat the Street like a rented mule.
And here’s the kicker: while everyone else is riding the rollercoaster, $TJX is just cruising — low beta, steady hands, fat dividends, and boat loads of free cash flow. The stock’s up 38% in the last year because they don’t play the panic game — they play the long game. They’ve mastered the art of turning chaos into cold, hard shareholder value.
Over the past five years, consumers have become sharply more price-conscious, driven by inflation, economic uncertainty, and shifting shopping habits. This shift has played directly into $TJX’s hands, as bargain-hunting has gone mainstream. $TJX offers top-tier brand names at 20% to 60% less than traditional retailers — often the exact same merchandise, just smarter sourced and faster moved.
In this stock study, we will look at an analysis of the following indicators and metrics which are our guidelines, and which dictate our behavior in deciding whether to find opportunities to buy, sell or stand aside on a particular stock:
- Wall Street Analysts Ratings and Forecasts
- 52 Week High and Low Boundaries
- Best-Case/Worst-Case Analysis
- Vantagepoint A.I. Predictive Blue Line Indicator
- Neural Network Forecast (Machine Learning)
- VantagePoint A.I. Daily Range Forecast
- VantagePoint A.I. Seasonal Analysis
- Intermarket Analysis
- Our Suggestion
While we make all our decisions based upon the artificial intelligence forecasts, we do look at the fundamentals briefly, just to understand the financial landscape that $HMY is operating in.
Wall Street Analysts Forecasts

The first thing we do when considering a trading opportunity is look at where Wall Street sees $TJX Companies heading over the next year. According to 19 analysts weighing in over the past three months, the average 12-month price target for $TJX stands at $141.38 — that’s 8.25% upside from its current trading price of $130.60 . The most bullish forecast pins the stock at $158 , while the most conservative outlook calls for $125 . In short, analysts remain optimistic about $TJX’s trajectory — reflecting continued confidence in one of retail’s most resilient performers.
We always suggest traders to pay close attention to the variance between the most bullish and most bearish forecasts as this is the expected volatility moving forward. Currently this level is $33 which is equivalent to 25% of the current price. This is a moderate level of future volatility.
52 Week High and Low Boundaries
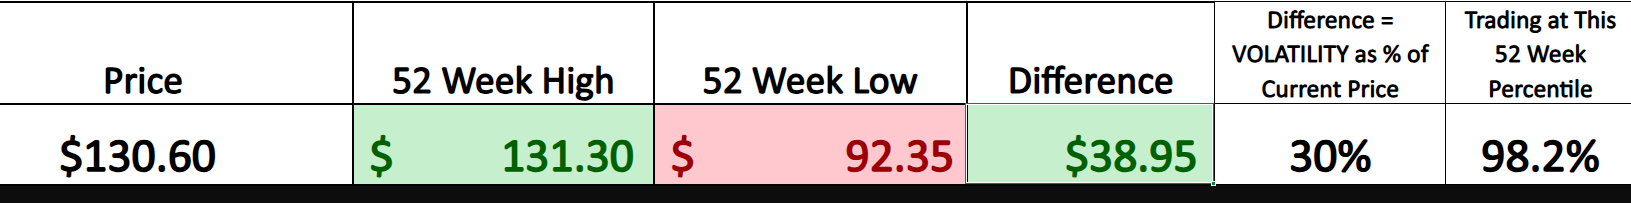
Let’s break this down like we do every trading opportunity — because when it comes to $TJX , understanding its 52-week high and low is a real-time window into investor psychology.
The most powerful understanding that comes out of the 52-week range is that it provides us with an understanding of historic volatility. We simply look at the difference between the high and the low price and express that as a percentage.
That high at $131.30? It’s the market shouting confidence, belief, and momentum. It tells you that big money is pouring in and the stock is getting a standing ovation from Wall Street. Now flip the script — when $TJX is hanging around its 52-week low, that’s fear, doubt, or maybe some misunderstood fundamentals. But here’s the kicker: smart traders don’t run from those extremes — they study them, dissect them, and use them as opportunities.
Breaking through a 52-week high? That’s not just a number — it’s a breakout, a possible launchpad for the next leg up. And those lows? Sometimes they’re traps, but sometimes they’re goldmines. Either way, this range is your GPS in the market jungle — guiding you through chaos and toward calculated, confident trades.
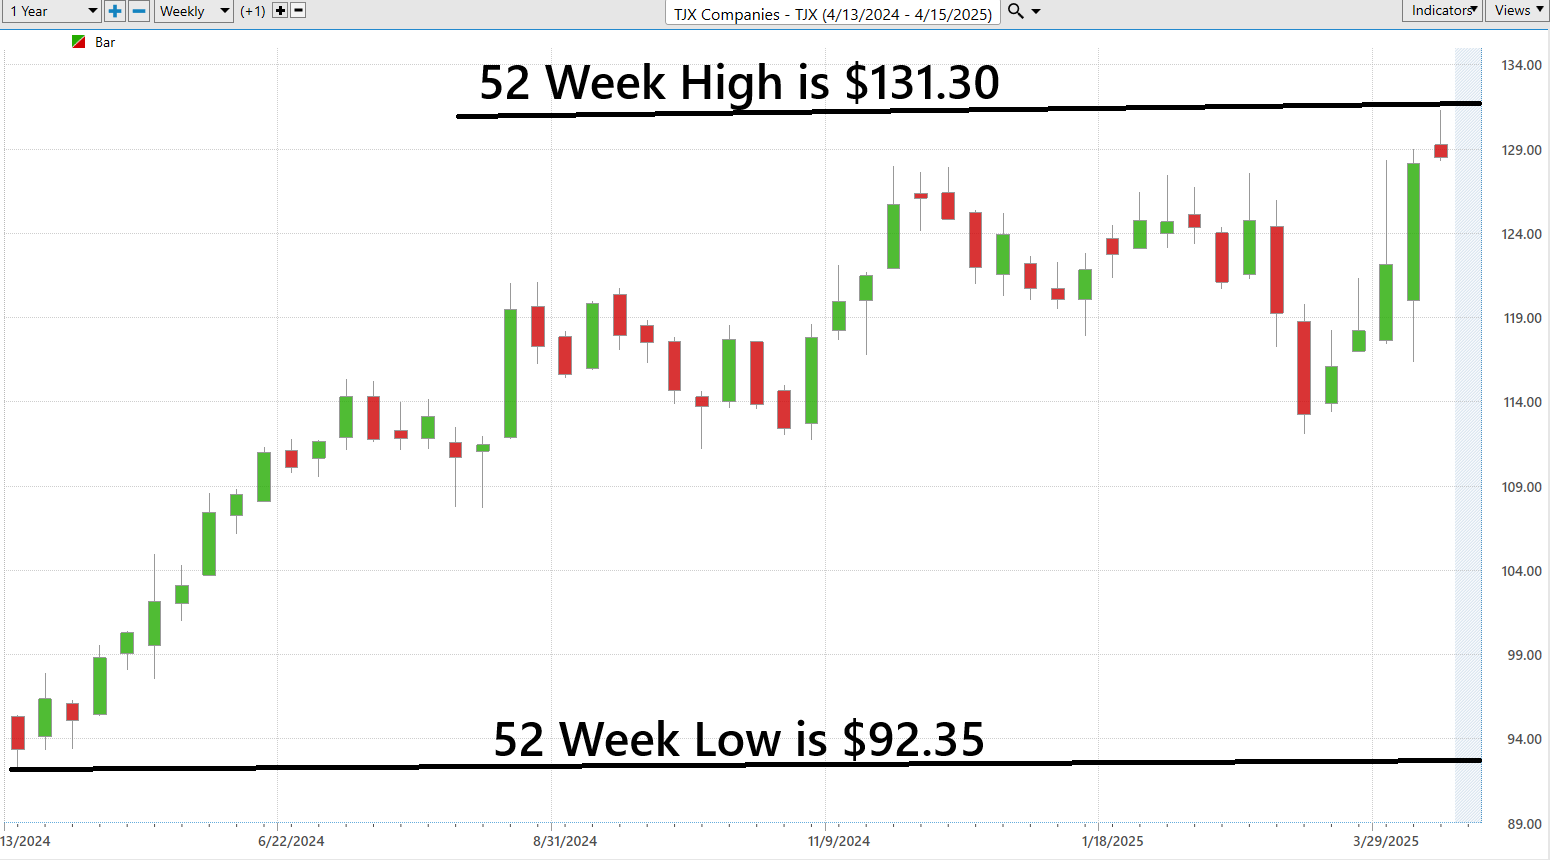
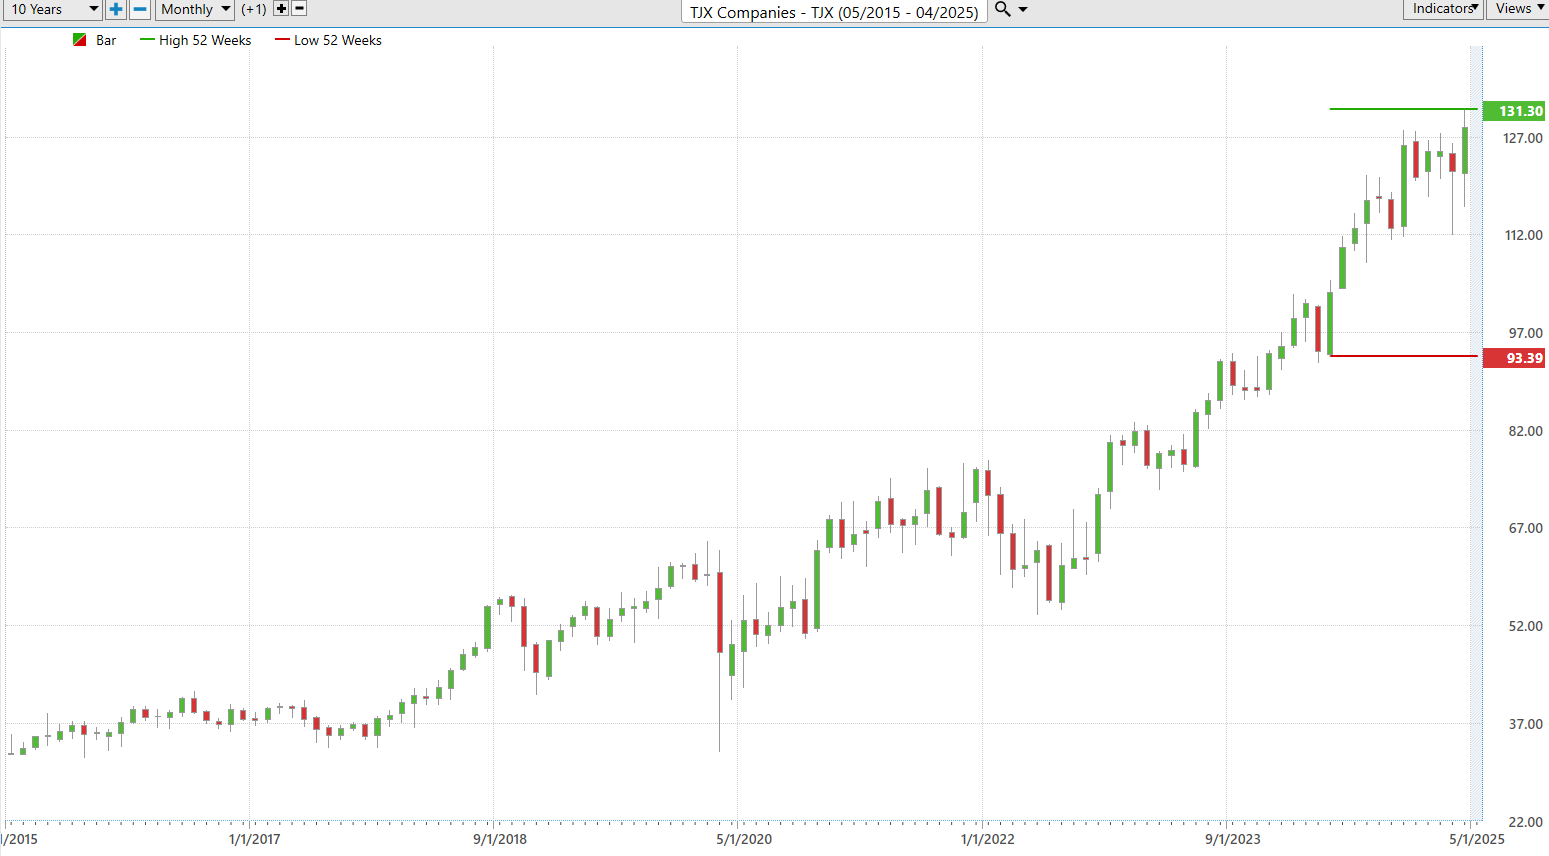
One of our favorite all time trading setups is focusing on stocks that are simultaneously making new 52-week highs and new 10-year highs.
Here is a chart of $TJX over the last 52 weeks.
When we zoom out and study the 10-year chart we see an equally impressive trend. When a stock is making new 52-week highs and new 10-year highs at the same time, it’s flashing a powerful signal of sustained strength and long-term institutional confidence. This rare alignment suggests the stock is not just leading in the short term — but breaking through major historical resistance, often marking the early stages of a major uptrend.
Best-Case/Worst-Case Analysis
Listen up, because I’m about to give you a lesson that most traders never learn — and it’s why they stay broke while the pros get rich.
If you really want to master this game — I mean own it — you’ve got to do more than just glance at charts and hope for the best. You need to dig into those price swings like a bloodhound on a scent. Every rally, every nosedive — they’re clues. Clues left behind by the big money players who move markets and leave breadcrumbs for those smart enough to follow.
The history of a stock? It’s not just data — it’s a crime scene, a battlefield, and a treasure map rolled into one. The past tells you everything: who won, who lost, and how the next battle might play out. Because here’s the dirty little secret — the market repeats itself . Not exactly, but close enough that if you’ve got eyes to see, you can ride the next wave before it breaks.
So let’s stop guessing and start knowing . Grab your magnifying glass, we’re about to dissect the most aggressive, uninterrupted surges a stock has made. This isn’t theory. This is the best-case scenario , and it’s how we sniff out the big winners before they hit the headlines.
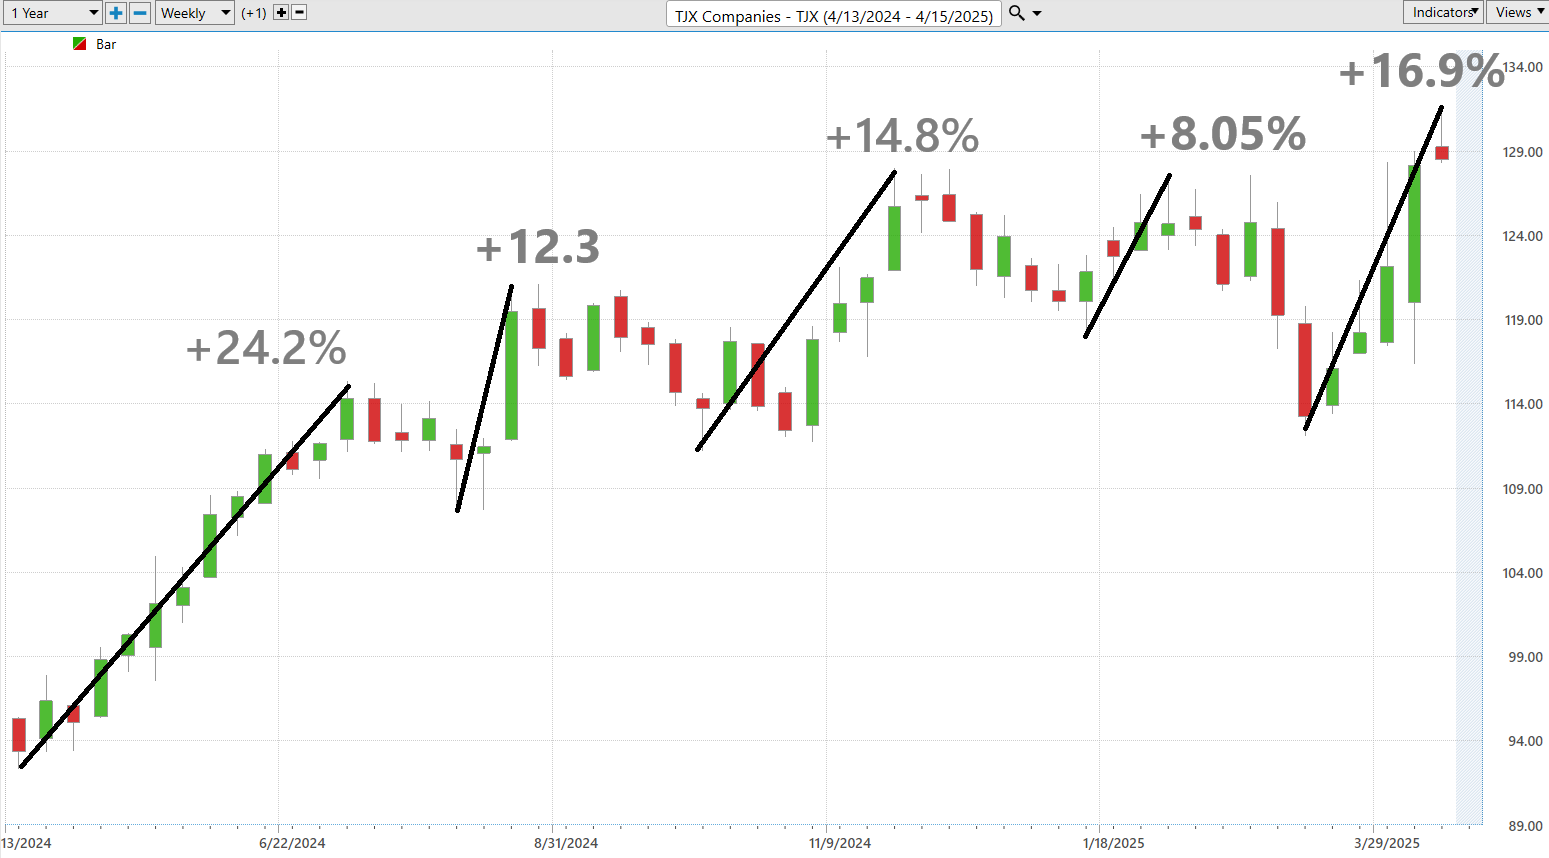
Followed by the worst-case scenario where we measure the magnitude of each uninterrupted decline.
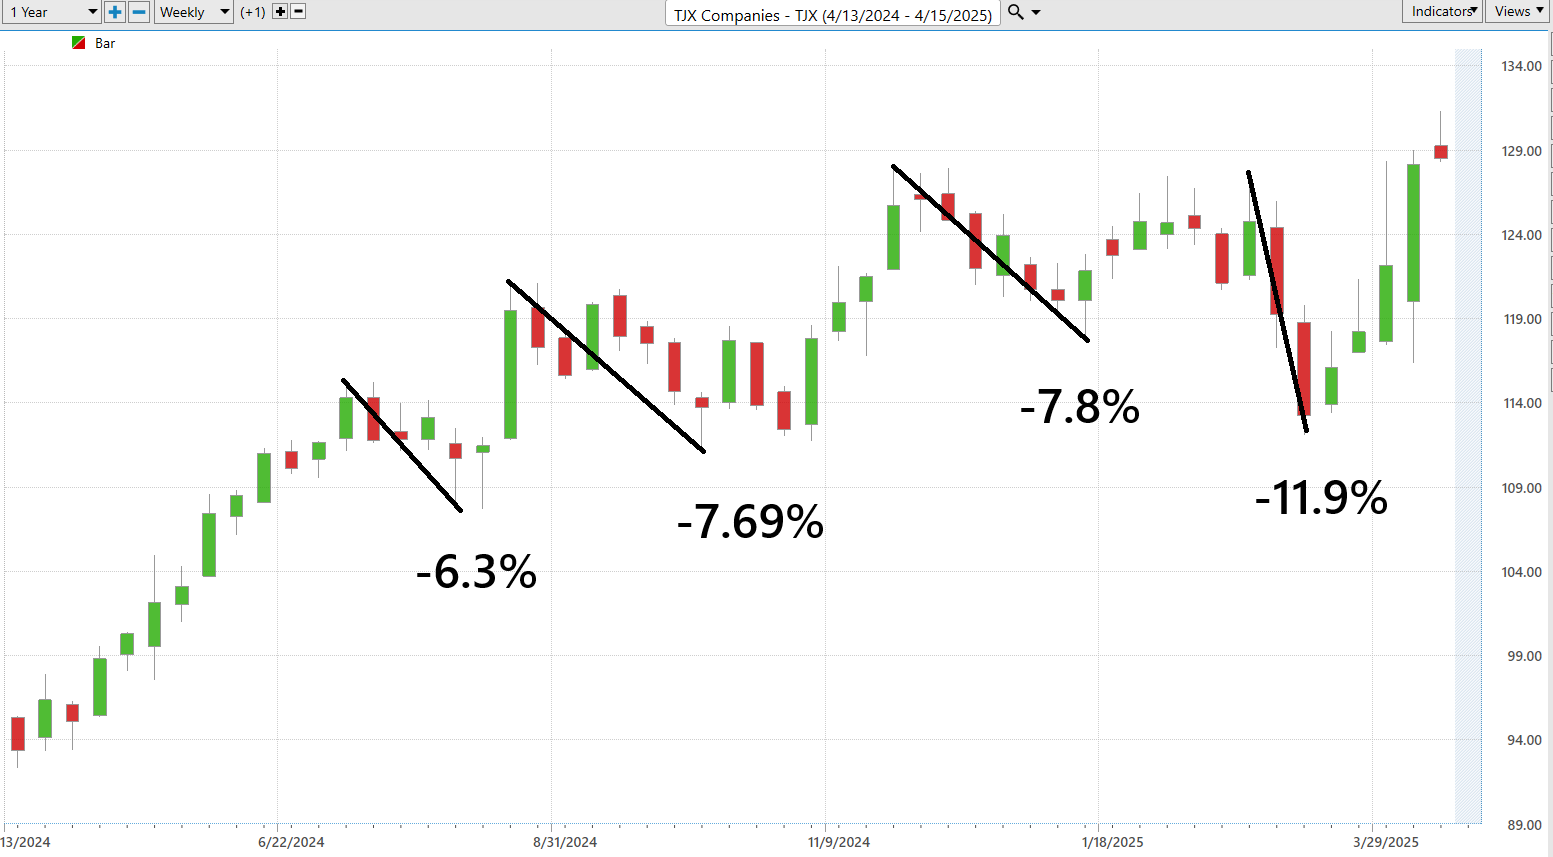
If you’re looking for the unfiltered, boots-on-the-ground truth about what’s really moving TJX Companies ($TJX) , then take a hard look at these charts. Forget the Wall Street fluff — this is where risk and reward get real, straight from the daily push and pull of the markets. If you want to know where the smart money’s paying attention, this is your launchpad. You can quickly see what the largest uninterrupted rallies and declines have been.
Let’s put $TJX under the lens and size it up against the broader market. You don’t just need to know how $TJX is performing in isolation. You need to see whether it’s leading the charge, getting dragged along, or standing strong against the tide. That’s the kind of insight that separates seasoned investors from the sidelines.
By measuring $TJX against the major indices, we get a true read on strength, momentum, and direction. This is how you cut through the noise and uncover the stock’s real potential in today’s fast-moving market.
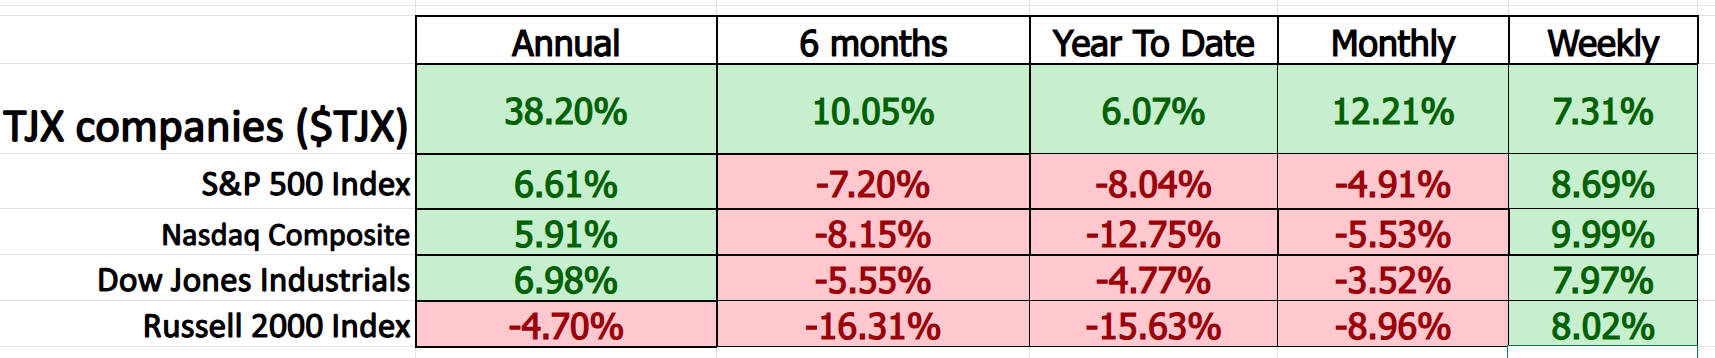
We can see that $TJX has clearly outperformed across all time frames.
TJX Companies ($TJX) has a 5-year beta of approximately 0.86 .
Imagine the stock market as a roller coaster. A beta of 1.0 means a stock moves up and down just like the market. $TJX’s beta of 0.86 indicates it experiences smaller ups and downs compared to the market. So, if the market rises or falls by 10%, $TJX’s stock might move about 8.6% in the same direction.
This suggests that $TJX is less volatile than the overall market, making it a steadier ride for investors. It’s like choosing a smoother roller coaster that still gets you to the finish line without as many twists and turns.
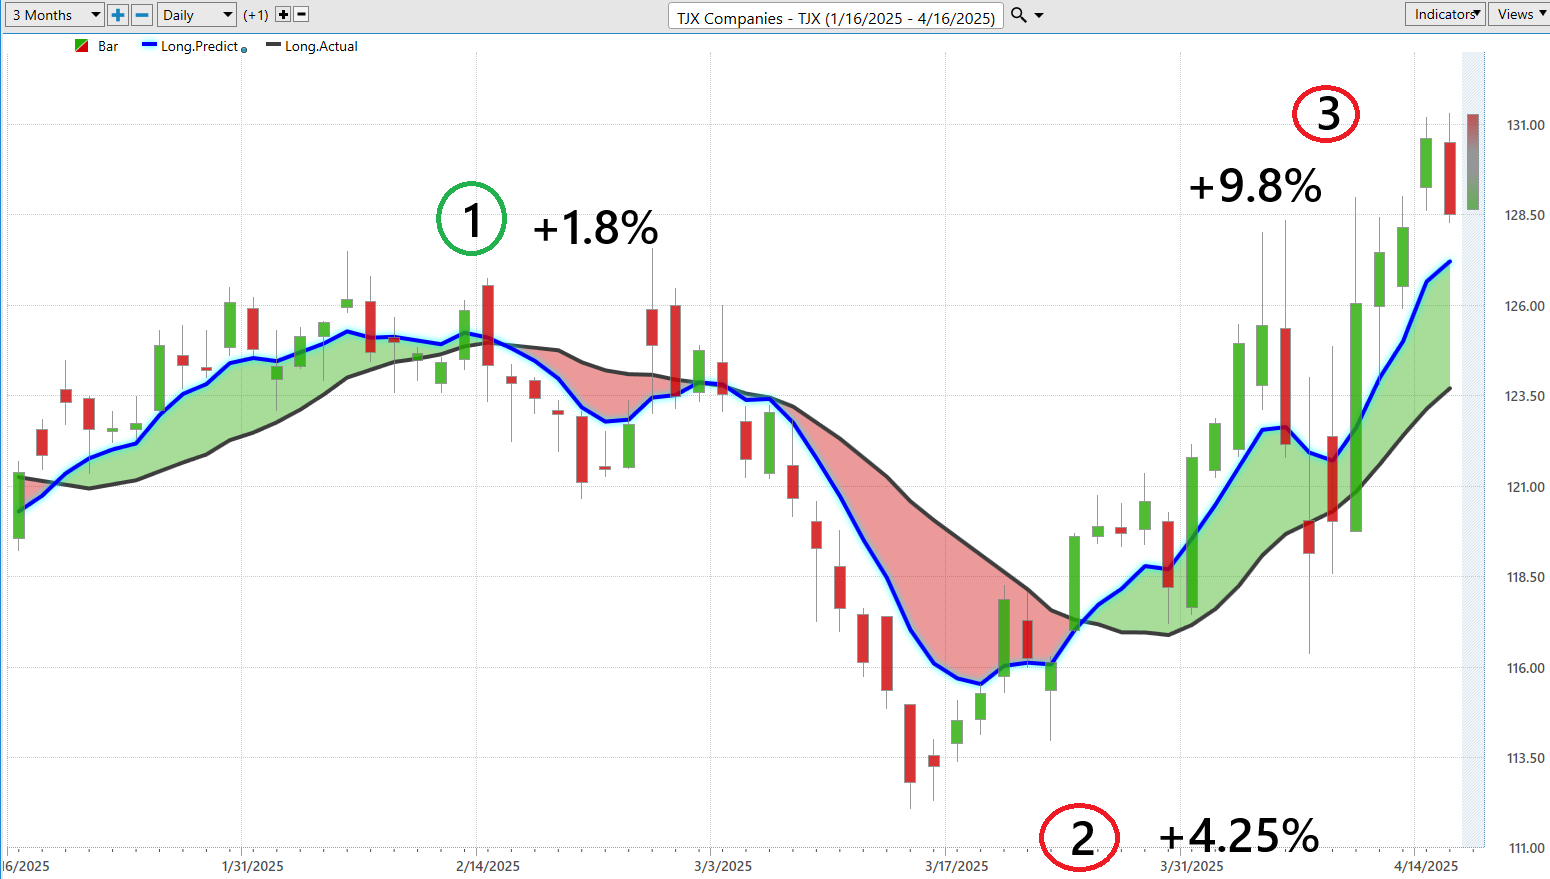
Vantagepoint A.I. Predictive Blue Line
If you’re looking to trade $TJX , let’s be clear — this isn’t a game for guesswork or gut feelings. The market doesn’t reward intuition — it rewards precision. Think of it less like a casino and more like a battlefield, where your only protection against being blindsided is a disciplined, data-driven strategy.
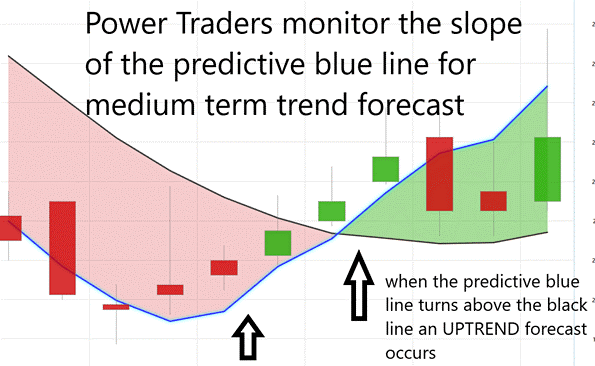
Now enter what VantagePoint calls the Predictive Blue Line . Don’t mistake this for some generic chart overlay. It’s an algorithmic indicator — engineered using artificial intelligence — that acts like a seasoned strategist, cutting through the noise and signaling when momentum is shifting. When the line trends upward, it’s a green light for traders to press in. But when that line dips? It’s a warning flare. Time to recalibrate.
There’s also what professionals refer to as the Value Zone — where decisions really matter. If $TJX is trending upward and touches or slightly dips below that blue line, it’s often a strong buy signal. But if the stock is trending lower and suddenly pops above that line, it might be your window to exit. These signals aren’t just technical trivia — they’re strategic inflection points that separate reactive traders from those ahead of the curve.
And should that Predictive Blue Line break sharply downward? It’s time to stop, reassess, and consider risk management strategies like hedging or reducing exposure. Winning in the market isn’t about being brave — it’s about being smart.
At the heart of this approach is VantagePoint’s A.I. — a platform that distills complex data and delivers actionable intelligence. In an environment dominated by uncertainty, this isn’t about outsmarting the market. It’s about making informed moves faster than the competition.
Here’s the takeaway: the Predictive Blue Line is a roadmap. For traders focused on $TJX , this isn’t optional. It’s the competitive edge. And over the last three months, it’s delivered three trend forecasts accurately. That kind of track record demands attention.
There have been three trend forecasts in the past 3 months. All of them have been successful.
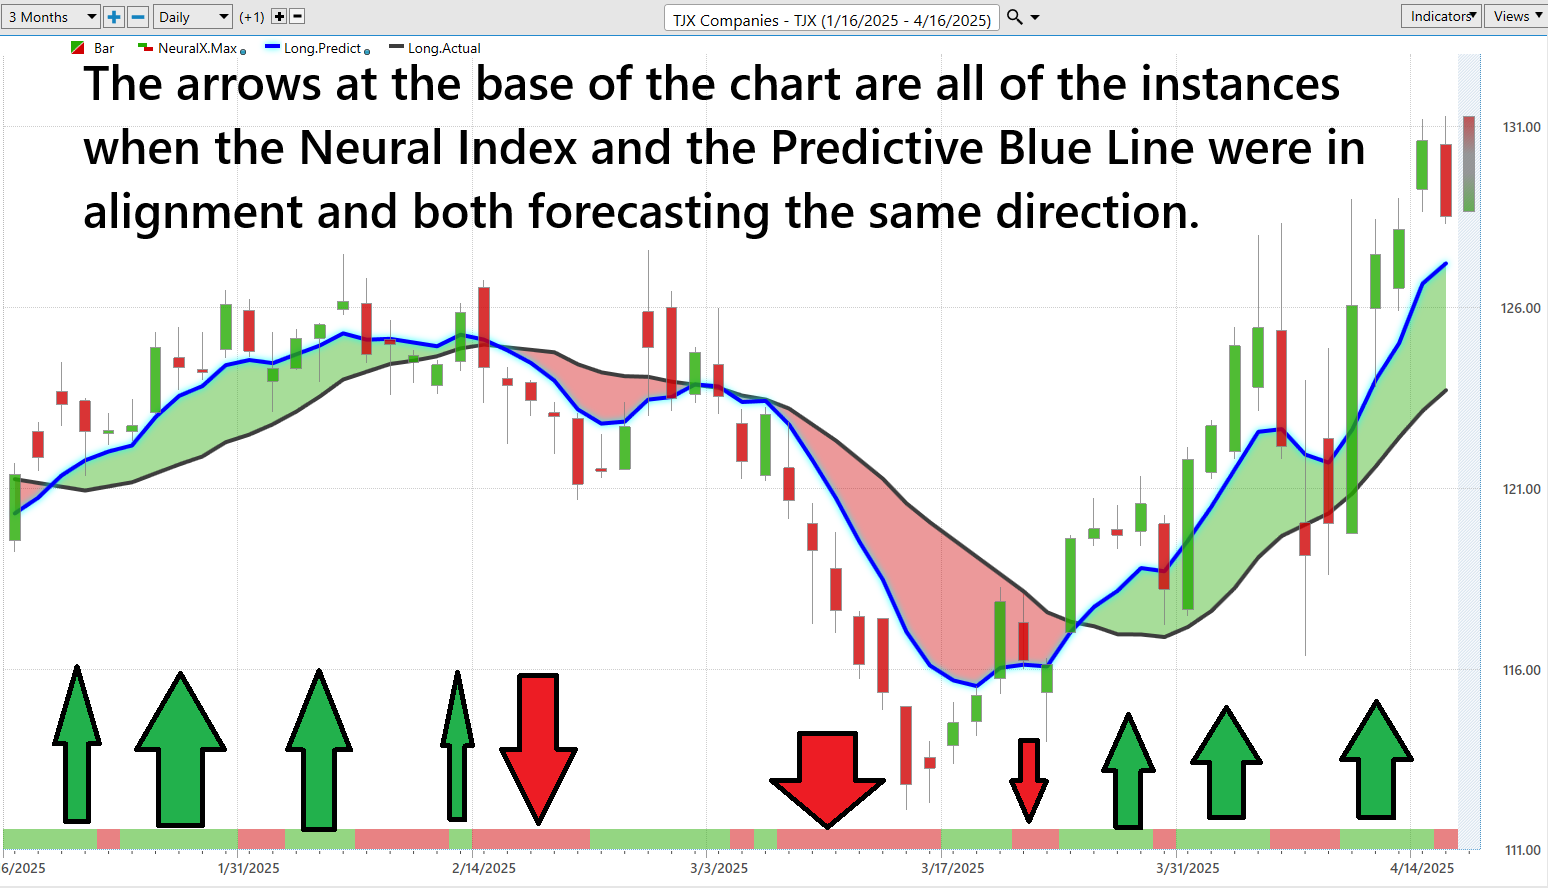
Neural Network Forecast (Machine Learning)
Alright, let me break it down for you in plain English — A neural network for traders? It’s A.I. with attitude — a relentless, data-slurping monster that never sleeps, never second-guesses, and doesn’t give a damn about CNBC headlines. This sucker takes in mountains of raw market data, tears it apart, learns the rhythm of the markets like a seasoned pit trader, and spits out predictive insights so on-point, they’ll make your old-school indicators look like kid’s toys.
It’s not just running the numbers — it’s learning from them. Constantly. Every blip, every tick, every hiccup in the market gets processed and fed back into the system to make it smarter, faster, and deadlier. Traders who plug into this beast are engineering their trades with precision that’ll leave the rest of the crowd choking on their dust. This thing doesn’t panic. It doesn’t get emotional. It doesn’t make stupid impulse trades because the Fed guy looked nervous on camera. It just processes. Pure data. Pure edge. That’s your unfair advantage.
Take VantagePoint’s A.I. Neural Network — this bad boy can forecast market direction 48 to 72 hours in advance. That’s not some back-tested fantasy — that’s real-time, boots-on-the-ground prediction based on how the market breathes. It’s like strapping a heat-seeking missile to your trading strategy.
So here’s the bottom line: If you’re serious about trading — I mean serious — you owe it to yourself to plug into this kind of firepower. Because in this game, smart money wins. Dumb money disappears. Your call.
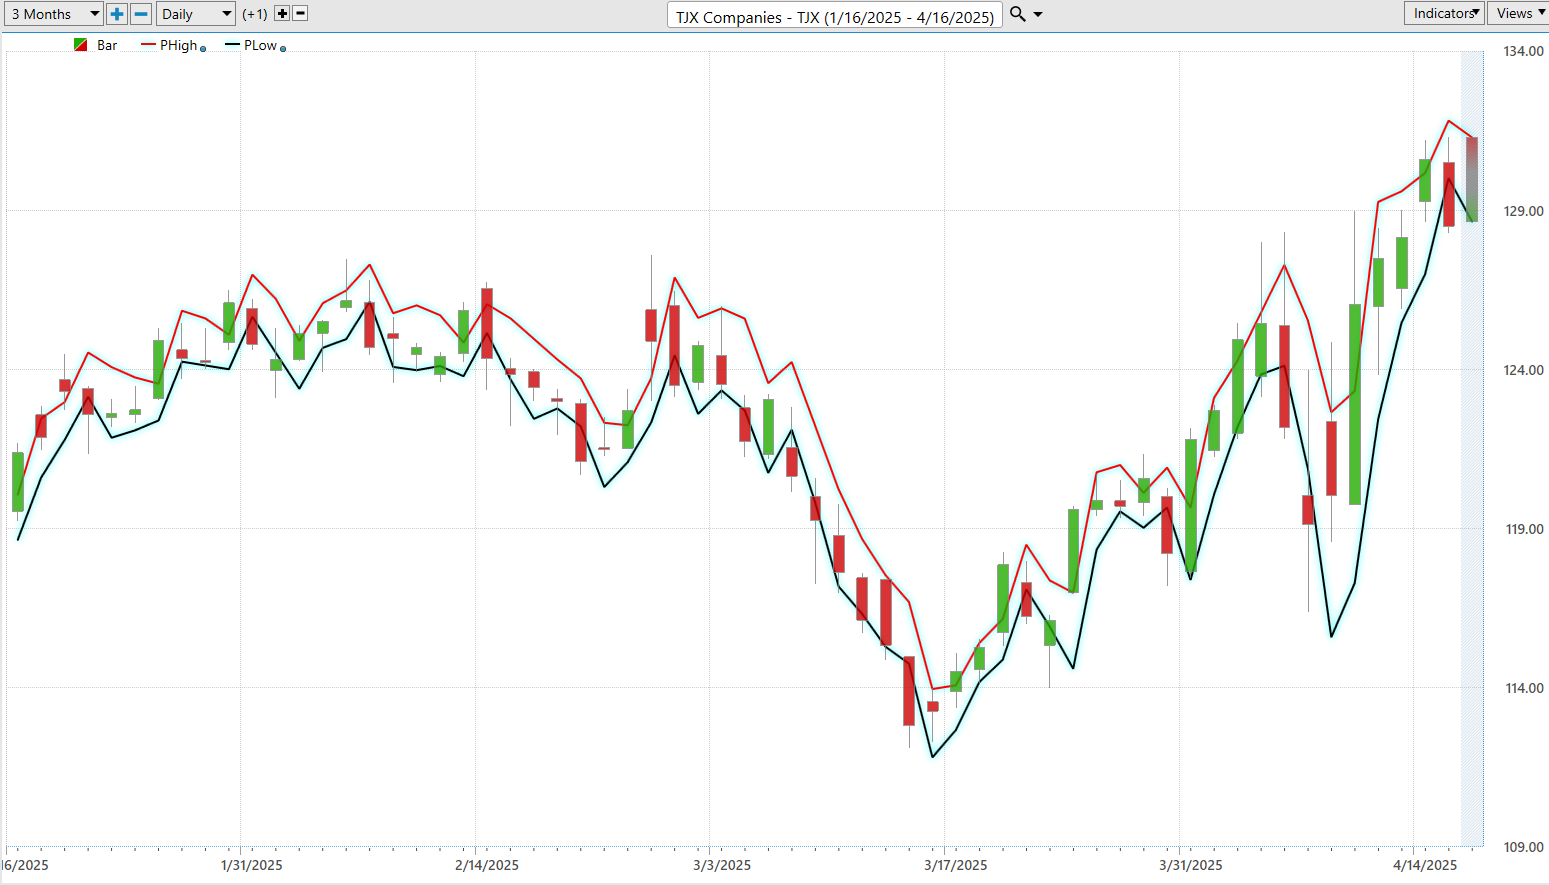
VantagePoint A.I. Daily Range Forecast
In the evolving landscape of modern markets, algorithmic systems capable of processing massive data sets in real time are no longer a luxury — they are the new standard. These systems have ushered in a seismic shift, moving traders from reactive decision-making to forward-looking precision. What once seemed like science fiction — identifying complex market patterns and projecting future moves with surgical accuracy — is now table stakes for staying competitive.
Armed with predictive analytics, today’s traders aren’t waiting for volatility to hit — they’re already positioned. The fusion of artificial intelligence and market acumen is giving rise to a more focused, disciplined approach — one where opportunity isn’t guessed at, but anticipated with intention and clarity.
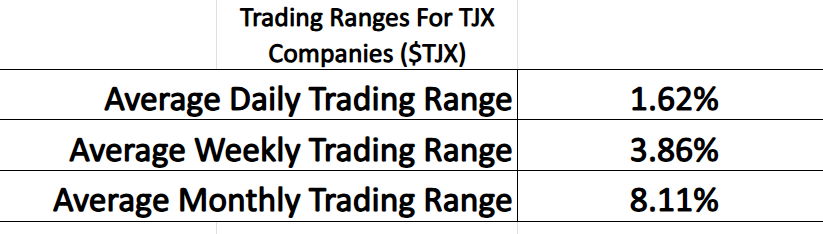
Take a closer look at TJX Companies ($TJX). By examining trading behavior across daily, weekly, and monthly time frames over the past year, we can see how machine learning not only enhances pattern recognition but delivers a strategy built for action. The data reveals consistent, tradable volatility — the kind of movement that, in the hands of a prepared trader, translates into tangible opportunity.
Below are the average daily, weekly, and monthly trading ranges for $TJX over the past 12 months — and the numbers tell a story: $TJX offers the type of dynamic price action that short-term traders thrive on.
If you’re a short-term trader, let me hand you a secret weapon — one that quietly separates the winners from the wannabes. You see, price movement is opportunity. The bigger the swing, the greater the reward— if you know how to time your entry and exit. Most traders stumble here, reacting after the fact. But the pros? They anticipate. They plan. They strike with precision.
That’s where VantagePoint’s A.I. Software steps in. It doesn’t just show you what the market did — it gives you a window into what it’s about to do . With daily range forecasts rooted in cutting-edge neural networks, this tool turns chaos into clarity. It hands you a roadmap of tomorrow’s trading landscape — today.
Think of it as the unfair advantage your competition doesn’t want you to have: a crystal-clear forecast in a world of noise. Use it wisely, and you won’t just trade better… you’ll trade smarter.
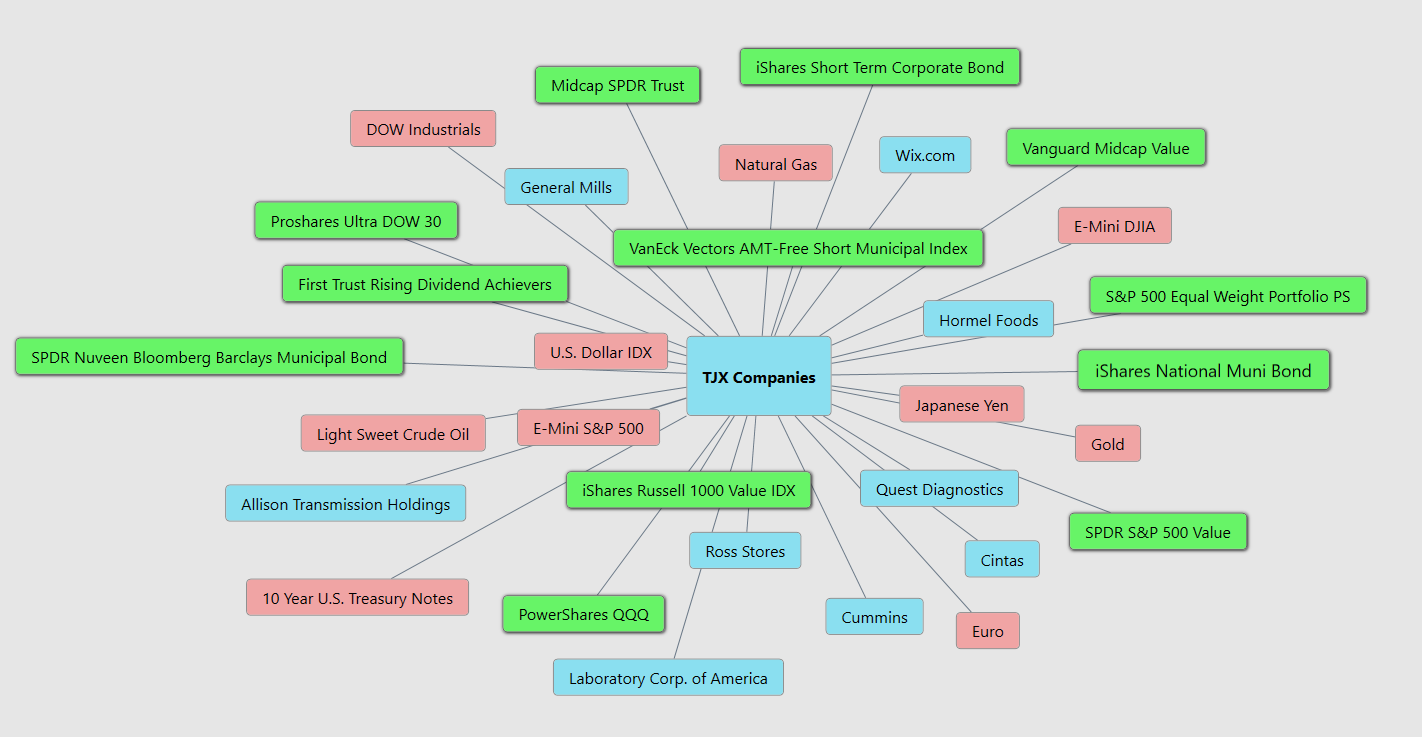
Intermarket Analysis
The stock price of TJX Companies, Inc. ($TJX) is influenced by a combination of macroeconomic factors, sector performance, and internal business dynamics that collectively shape investor sentiment and market valuation. As a leading off-price retailer in the consumer discretionary sector, $TJX is highly sensitive to consumer confidence and discretionary spending trends. When economic conditions are favorable and equity markets are rising, consumers are more likely to spend, and investors often rotate into discretionary stocks—providing a tailwind for $TJX. Conversely, during economic slowdowns, $TJX’s value-focused model becomes increasingly attractive to cost-conscious shoppers, allowing it to perform well even in downturns. Interest rates also play a critical role; higher borrowing costs can suppress consumer spending, especially on home-related goods sold through $TJX’s HomeGoods segment. However, $TJX’s broad appeal and pricing advantages tend to soften the impact, helping the company maintain stability in various rate environments.
Other important price drivers include commodity prices, currency fluctuations, trade policy, and competitive positioning. Rising input costs — such as cotton, oil, and shipping — can pressure margins, yet $TJX’s flexible inventory model and deep vendor network enable it to secure discounted merchandise efficiently. Currency strength also matters: a strong U.S. dollar lowers import costs, while a weaker dollar boosts international earnings when converted back to USD. Additionally, trade tensions and tariffs can disrupt supply chains, but $TJX is seen as relatively insulated due to its diversified sourcing strategy. On the operational front, the company’s dominant market share in the off-price retail space, high return on equity, consistent comparable store sales growth, and expanding digital presence have all contributed to strong stock performance. $TJX’s ability to combine financial discipline with agility across economic cycles has established it as a resilient, attractive equity holding in both growth and defensive strategies.
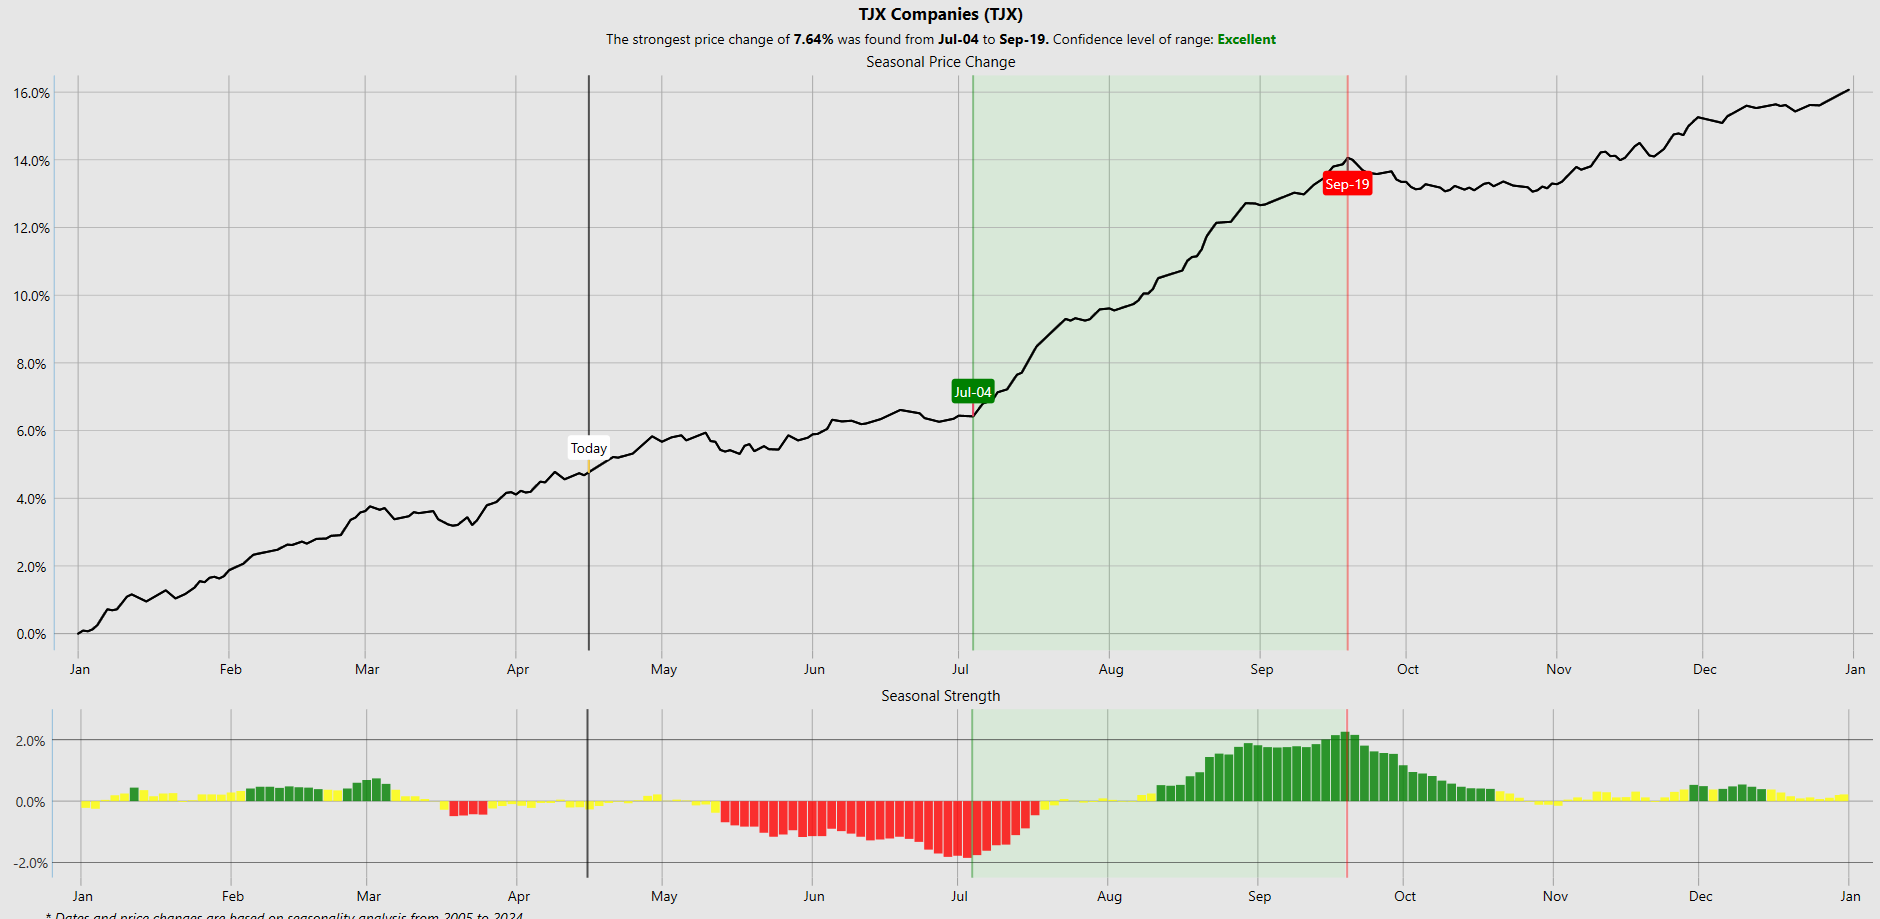
VantagePoint A.I. Seasonal Analysis
There are patterns hiding in plain sight — etched not just in charts, but in the calendar itself. Seasonality is the financial world’s version of clockwork: reliable rhythms that show up again and again — January rallies, summer slumps, harvest-time price spikes in agricultural commodities. But these aren’t just folklore or financial old wives’ tales. They’re backed by decades of real market behavior. If you know when to look, what to look for, and how to interpret it, seasonality becomes more than a curiosity — it becomes a serious edge.
But like any edge, it must be sharpened. That’s where seasonal analysis comes in. By analyzing years — even decades — of price action, traders can uncover persistent patterns that tend to repeat during specific times of the year. But here’s the trick: the best use of seasonal data is as a confirming signal, not a standalone oracle. Use it with your technical indicators, your fundamental convictions, and your gut-trained instincts — and you’ve got yourself a three-legged stool of conviction.
Now, is it perfect? Of course not. There’s no free lunch in the markets. But when you’re dealing with something that works 70% to 80% of the time — like seasonal patterns in grains or energy — and you combine that with other tools, you’re stacking probability in your favor. That’s what pros do. They don’t just guess — they tilt the game. And that’s exactly what understanding seasonality lets you do: tilt the game toward profit, timing, and tactical advantage.
Here is VantagePoint’s A.I. Seasonal Analysis for $TJX. You can see that the expectations moving forward for the next several months are positive.
Our Suggestion
Over the past 90 days, The $TJX Companies, Inc. ($TJX) has delivered a strong 15.6% stock price gain, supported by consistent earnings beats and bullish guidance in its Q3 and Q4 FY24 calls. Power Traders are utilizing strategies that look to buy weakness if the A.I. daily range forecast indicate that the trend is still up.
This is the kind of thing most investors miss while they’re too busy chasing shiny objects…
$TJX didn’t just outperform the market— it torched it. While the S&P 500 dragged its feet with a measly 6–7% gain, and competitors like Ross, Burlington, and Macy’s were left sucking wind, $TJX roared ahead with a nearly 40% return.
The Seasonal probabilities favor the uptrend continuing for the next few months.
Place $TJX on your trading radar as it will create numerous trading opportunities over the coming year.
Let’s Be Careful Out There.
It’s not magic.
It’s machine learning.
Disclaimer: THERE IS A HIGH DEGREE OF RISK INVOLVED IN TRADING. IT IS NOT PRUDENT OR ADVISABLE TO MAKE TRADING DECISIONS THAT ARE BEYOND YOUR FINANCIAL MEANS OR INVOLVE TRADING CAPITAL THAT YOU ARE NOT WILLING AND CAPABLE OF LOSING.
VANTAGEPOINT’S MARKETING CAMPAIGNS, OF ANY KIND, DO NOT CONSTITUTE TRADING ADVICE OR AN ENDORSEMENT OR RECOMMENDATION BY VANTAGEPOINT AI OR ANY ASSOCIATED AFFILIATES OF ANY TRADING METHODS, PROGRAMS, SYSTEMS OR ROUTINES. VANTAGEPOINT’S PERSONNEL ARE NOT LICENSED BROKERS OR ADVISORS AND DO NOT OFFER TRADING ADVICE.