Macro field conditions remain messy for U.S. equity markets. Since the April 2 unveiling of reciprocal tariff rates from the White House, there have been more questions than answers on what comes next. There has been lots of trade talk and promises of progress, but there has been no dry ink on any trade deals with the 75 countries that have reached out to negotiate. So, in the spirit of the NFL Draft kicking off tomorrow, and with the administration’s 90-day tariff pause expiring in July, the U.S. is officially “on the clock” to start drafting deals.
India has appeared as a potential first-round pick. Following a four-day trip to the country, Vice President JD Vance voiced optimism for strengthening trade relations with India, declaring, “The future of the 21st century is going to be determined by the strength of the United States and India partnership.” China could also be unexpectedly moving up the draft order, as the White House announced, “the ball is moving in the right direction with China.” At the same time, Treasury Secretary Scott Bessent told reporters yesterday that “neither side thinks the status quo is sustainable.” Even President Trump recently softened his tone on China, stating there was no need to play “hardball” on trade and that China’s tariff rate will “come down substantially, but it won’t be zero.”
Although no official trade deals have been reached yet, negotiation progress is a step in the right direction that helps change the narrative from how high tariff rates could be, as presented on “Liberation Day,” to how low they could go via trade deals. Furthermore, the transition to trade negotiations suggests peak economic uncertainty (and perhaps fear) was likely reached earlier this month.
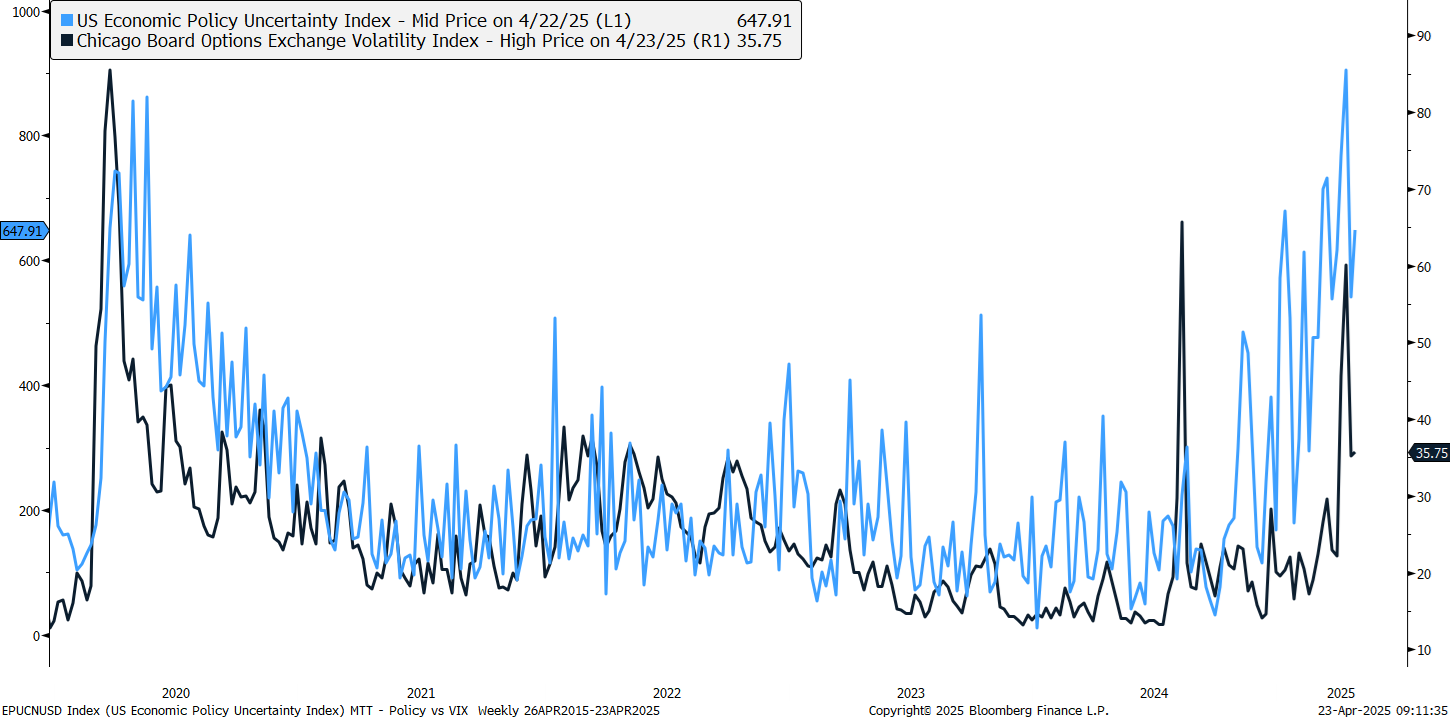
The “Peak Panic and Uncertainty” chart compares the U.S. Economic Policy Uncertainty Composite Index to the CBOE Volatility Index (VIX) to support this thesis. For context, economic policy is measured through a mix of indicators, including references to economic uncertainty across major newspapers, the number of federal tax code provisions set to expire, and disagreement among economic forecasts. The VIX measures the expected 30-day volatility of the S&P 500 based on options prices, with a rising VIX indicating increased fear and uncertainty, and a declining VIX indicating the opposite. It also serves as a sentiment gauge and a tool for hedging equity positions.
Peak Panic and Uncertainty

Historically, U.S. economic policy uncertainty and the VIX have shown a close relationship, with rising policy uncertainty often accompanied by a rising VIX. Over the last two months, this correlation has been especially true as the two gauges recently surged to outlier highs earlier this month. Now, with the tariff sticker shock of “Liberation Day” behind us, and the White House working toward trade deals, both policy uncertainty and the VIX have dropped significantly from their recent highs. And while both gauges remain elevated, pointing to relatively high levels of economic uncertainty and implied volatility in stocks, they also suggest we are likely past peak uncertainty and fear at this stage.
What Does This Mean For Stocks?
Peak policy uncertainty was one of the many items on our checklist for identifying a probable low in this deep correction. Several of the other items on our list were also checked earlier this month, including (but not limited to) historically oversold momentum at the index and constituent level, washed-out readings across market breadth metrics, peak fear/pessimism, and elevated trading volume. Now, with the weight of the technical evidence suggesting stocks have reached a capitulation point, what comes next?
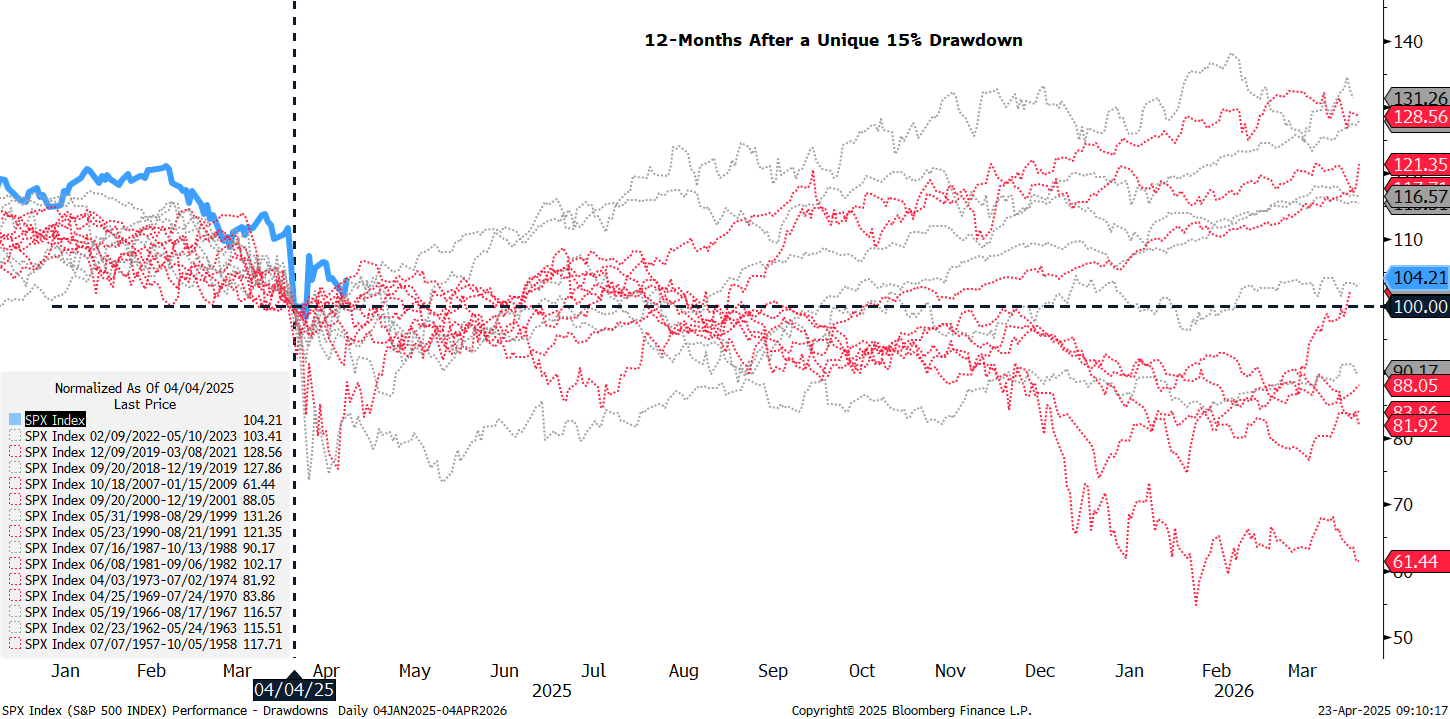
History suggests that price action following at least a 15% drawdown can be choppy. As highlighted in the “S&P 500 Progression After a 15% or Greater Drawdown” chart, over half of these periods (8 out of 14, highlighted in red) also overlap with a recession. In terms of a recovery, V-shaped rallies after a 15% drawdown are relatively rare, with 2020, 2018, and 1998 notable standouts (these rallies were importantly accompanied by a policy pivot from the Federal Reserve (Fed)). Outside of these periods, returns tend to skew flat to negative in the first few months following a 15% drawdown, suggesting we should expect more of a bottoming process than an immediate and swift recovery. Returns have historically been more positive on a 12-month basis, averaging around 5% across all periods, with nine of 14 occurrences producing positive results.
S&P 500 Progression After a 15% or Greater Drawdown

Summary
The narrative transition from tariff rates to tariff deals is an important step in the recovery of the equity market. This change suggests we have likely moved beyond peak policy uncertainty and fear, an important piece of the market low puzzle. Other technical evidence also suggests stocks have reached a capitulation point. However, a sustainable recovery will require some much-needed technical repair, as the majority of S&P 500 stocks remain in a downtrend, and a shift back toward risk-on leadership. Furthermore, history reveals most bottoms are a process that often involves a retest of the initial lows. V-shaped recoveries are rare and are typically accompanied by a pivot from the Fed, an unlikely scenario given Chair Powell’s continued “patient” approach with monetary policy.
***
Important Disclosures
This material is for general information only and is not intended to provide specific advice or recommendations for any individual. There is no assurance that the views or strategies discussed are suitable for all investors. To determine which investment(s) may be appropriate for you, please consult your financial professional prior to investing.

