AUD/USD price action on the longer-term weekly chart now sees AUD bulls retesting the downward trendline resistance level (black) for the fourth time since February 2021. A major area of confluence like this could be central to traders and their directional biases in 2024. A confirmation close above could see a runup towards the 0.7000 psychological handle, while a failure may bring back into consideration the 0.6500 support level and beyond.
AUD/USD Weekly Chart
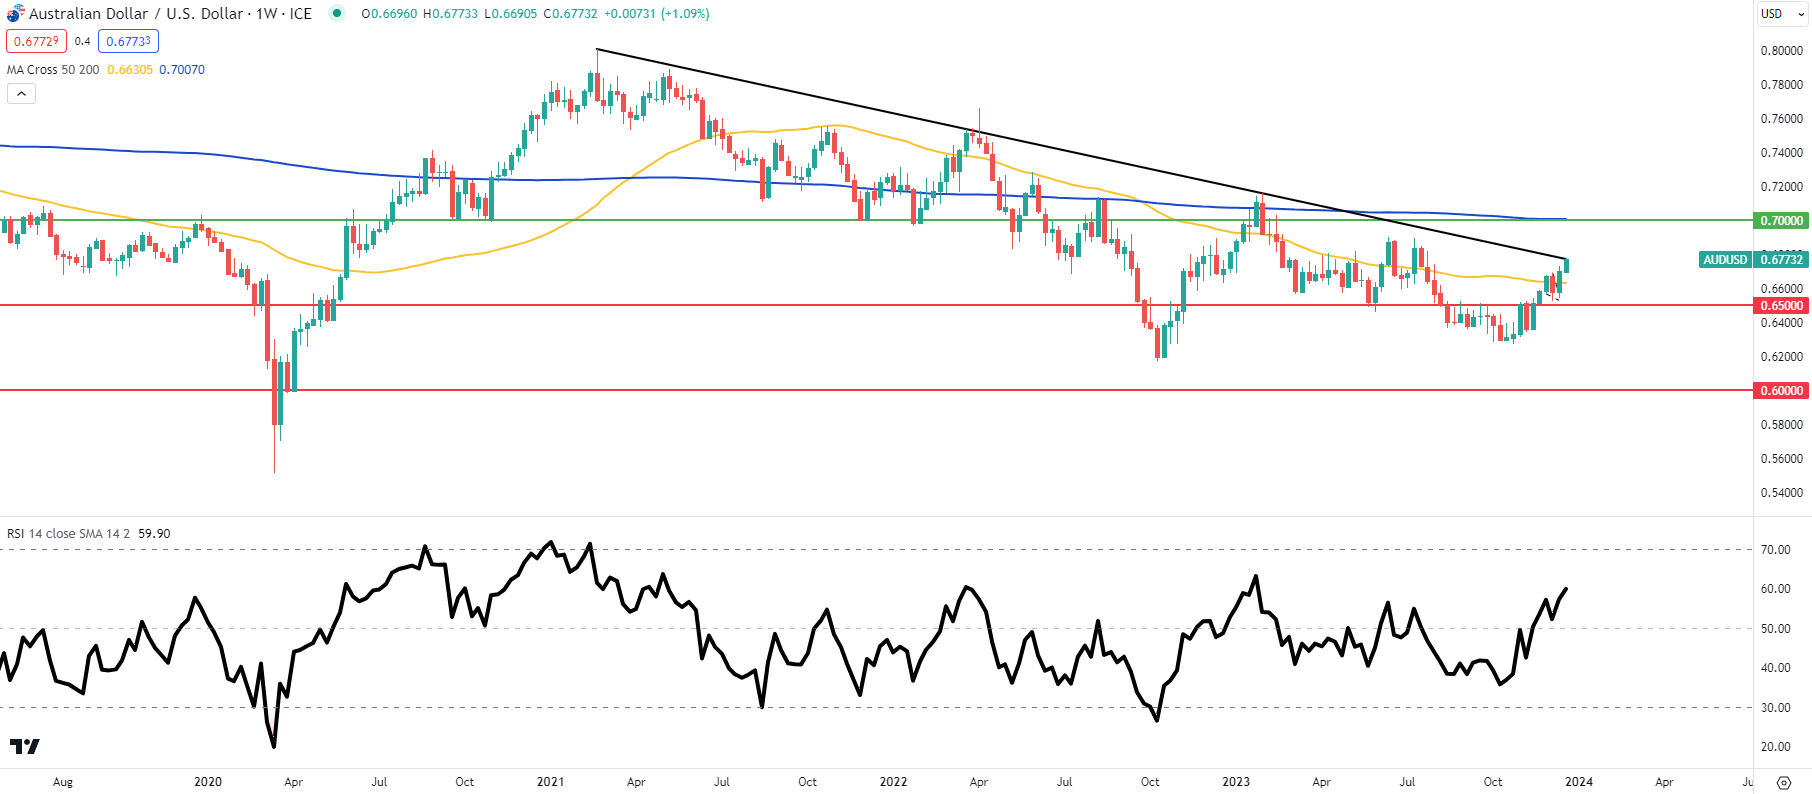
Source: TradingView, Prepared by Warren Venketas
Focusing on the daily chart below, it is clear that the pair is in overbought territory as measured by the Relative Strength Index (RSI). I expect a pullback lower in January but with bullish momentum ( prices trading above both 50-day and 200-day moving averages) in favour, downside may be short-lived. In conclusion, I do not expect any meaningful appreciation relative to current levels but my longer-term view as we head further into 2024 should facilitate upside sustenance for the AUD ceteris paribus.
AUD/USD Daily Chart
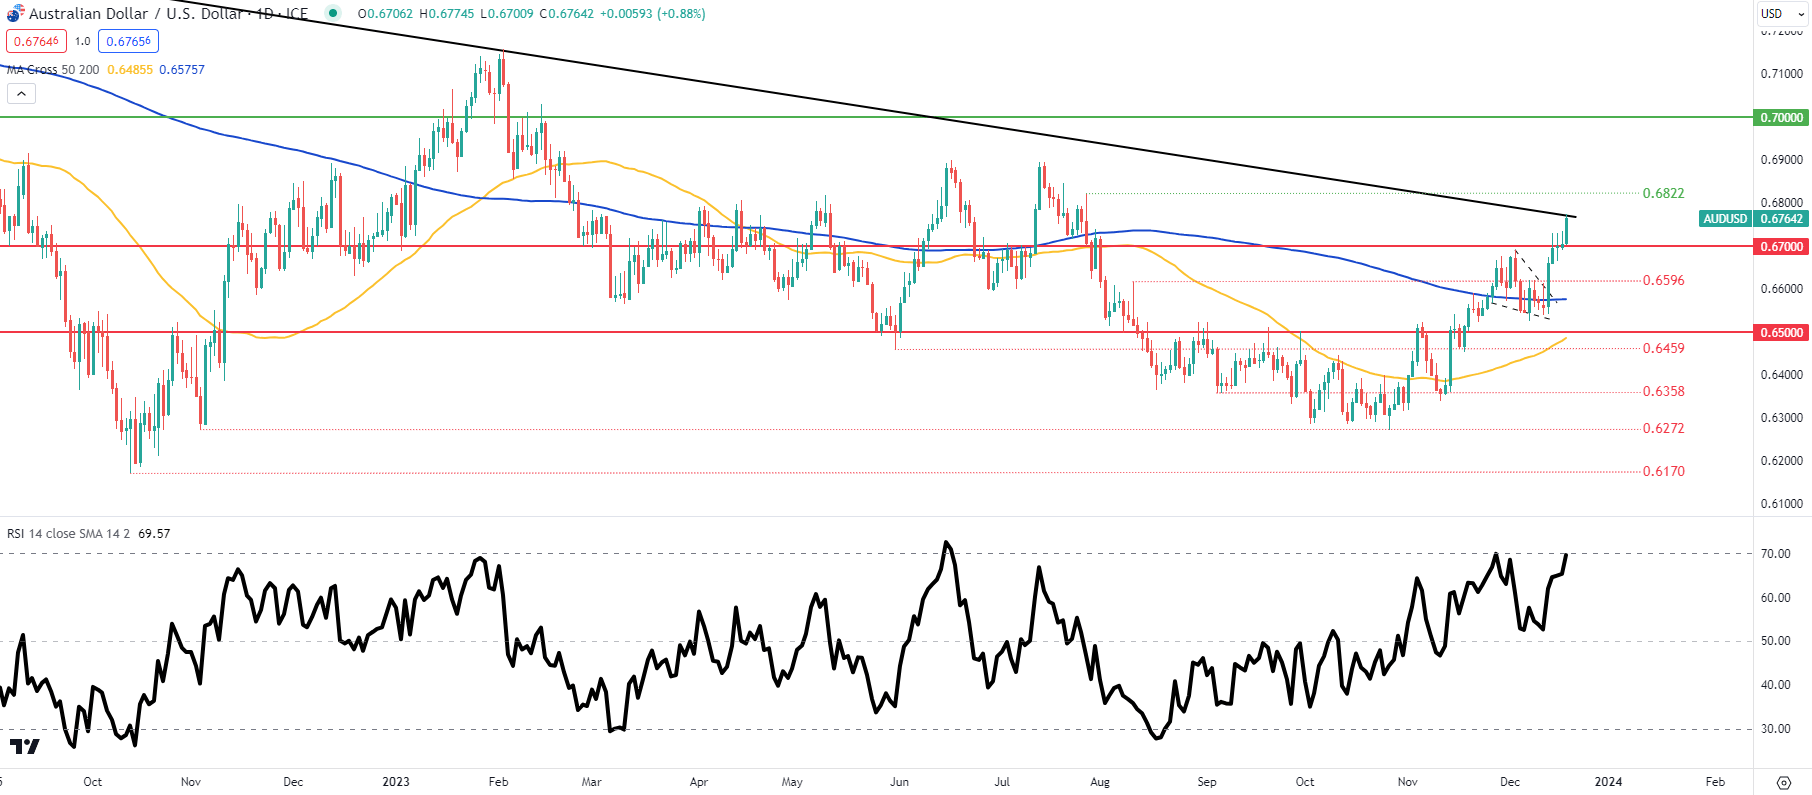
Source: TradingView, Prepared by Warren Venketas
- 0.7000
- 0.6822
- Trendline resistance
- 0.6700
- 0.6595
- 200-day MA (blue)
- 0.6500