Dow Jones, Nasdaq 100, Nikkei 225 Analysis and Charts
Dow above 37,000
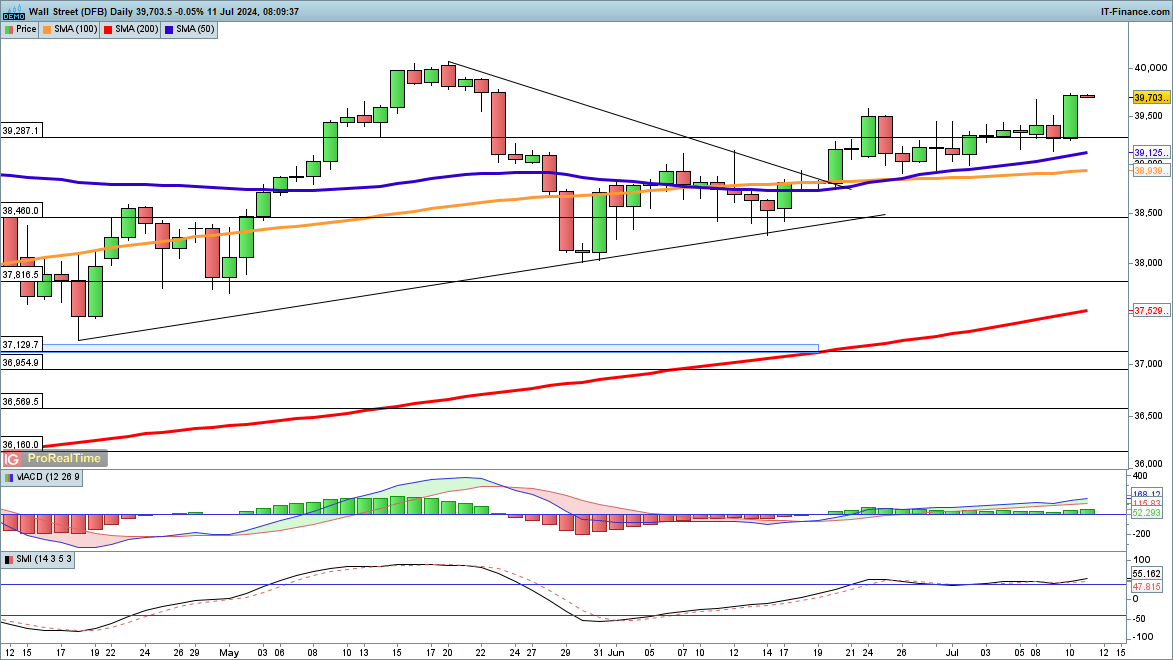
The index has finally made strong gains, rallying to a seven-week high, though it remains below the May record highs, in contrast to the S&P 500 and Nasdaq 100. Further gains target that May high, at 40,080. For the moment, higher intraday lows continue to indicate bullish momentum, and the short-term view remains bullish so long as the price holds above the 50-day simple moving average (SMA), currently 39,125.
A close back below 39,000 would negate the short-term bullish view and potentially open the way to the 38,500 and then 38,000 levels.
Dow Jones Daily Chart
| Change in | Longs | Shorts | OI |
| Daily | -30% | 13% | -5% |
| Weekly | -19% | 12% | 0% |
Nasdaq 100 at new highs ahead of CPI
Another day, another record high for the index, with no sign of any pre- CPI nervousness. Trendline support from the 1 July low continues to underpin in the short-term, but a close back below 20,500 might indicate that a high has been reached for the time being.
There is, as yet, little sign of any more substantial pullback beginning to emerge.
Nasdaq 100 Daily Chart

Nikkei 225 continues to surge
The index has added around 12% in the space of less than a month, climbing through 42,000 for the first time in its history.Short-term consolidation may lie ahead, though the overall bullish view remains firmly in place. A short-term pullback may head towards 41,163, the previous record high.
Nikkei 225 Daily Chart