Nasdaq, Gold, US Dollar Analysis and Charts
- Nasdaq 100 eyes 20,000 as buyers remain in control.
- Gold slips as risk sentiment turns positive.
- US dollar little changed, markets eye SNB and BoE this week.
The technology sector in the United States continues its upward momentum, propelled by the persistent demand for the Mag 7 stocks. The Nasdaq 100 index is nearing the significant 20,000 level. The top three corporations in the Nasdaq – Nvidia, Microsoft, and Apple – collectively account for nearly 26% of the index's total market capitalization. This figure underscores the substantial concentration risk posed by these Mag 7 stocks within the index.
Nasdaq Daily Price Chart

The United States dollar is maintaining a steady course in early trading, with a scarcity of high-impact data or events this week to provide directional guidance. US Treasury yields persist at or slightly above their recent multi-week lows, while expectations for US interest rate cuts remain largely unchanged. The market currently anticipates the first reduction in November, although a move at the September meeting would not come as a surprise. Furthermore, an additional rate cut is expected by the end of the year.

The US dollar index is trading around 105.60 and is consolidating its recent move higher. The greenback is back above all three simple moving averages, a bullish signal, but looks overbought using the CCI indicator.
USD Daily Price Chart

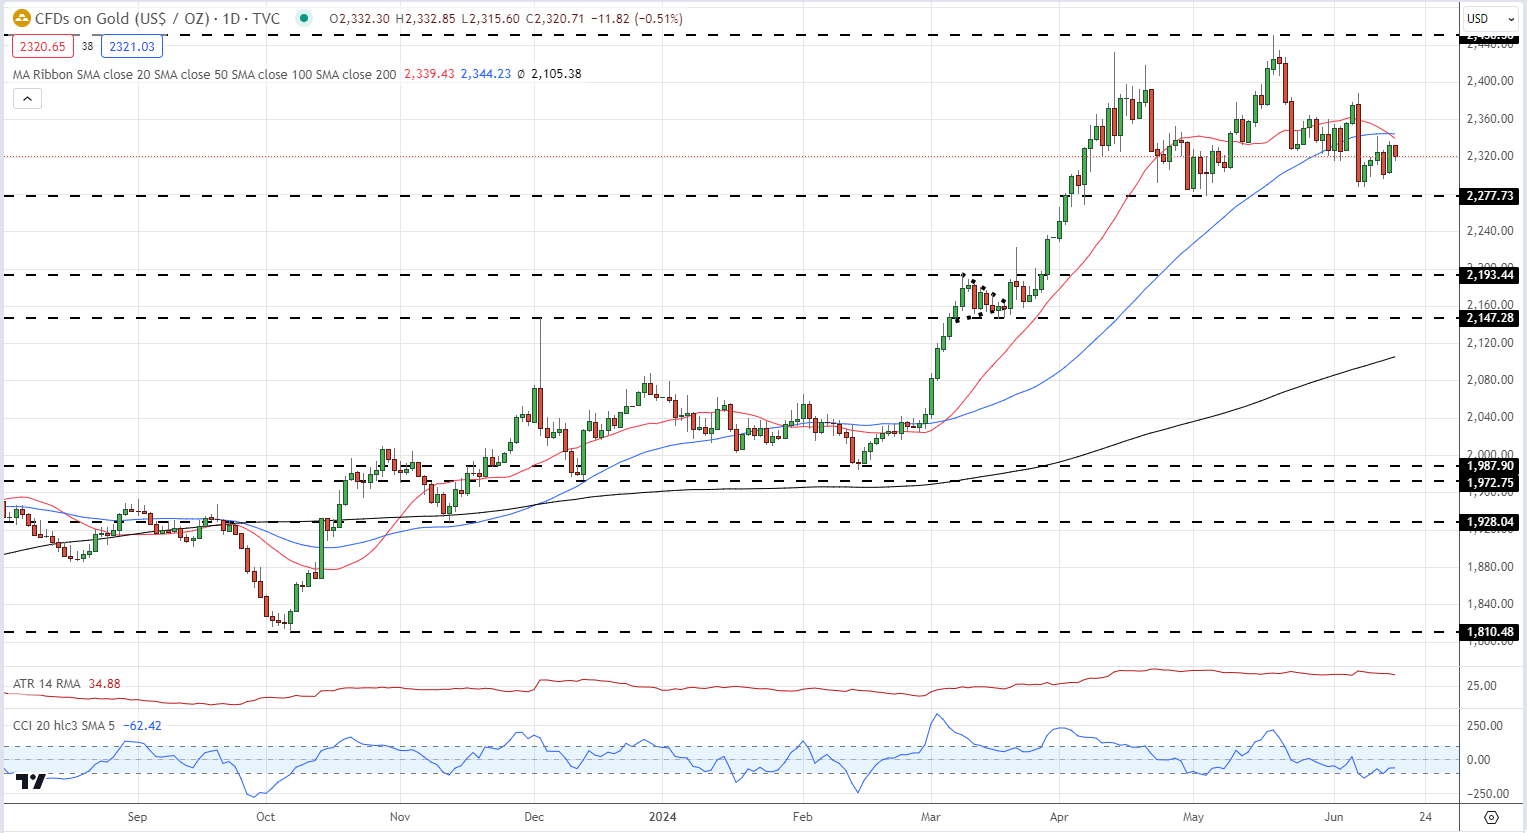
Gold is consolidating its recent gains and remains within a multi-week range. The 20- and 50-day simple moving averages are currently acting as short-term resistance, and these need to be broken and opened above to keep the precious metal moving higher. Support just below $2,280/oz. should hold in the short term.
Gold Respecting a Recent Trading Range but Support Needs to Hold Firm
Gold Daily Price Chart

Retail trader data shows 56.86% of traders are net-long with the ratio of traders long to short at 1.32 to 1.The number of traders net-long is 1.99% higher than yesterday and 22.10% lower than last week, while the number of traders net-short is 0.30% higher than yesterday and 33.70% higher than last week.
We typically take a contrarian view to crowd sentiment, and the fact traders are net-long suggests Gold prices may continue to fall. Positioning is more net-long than yesterday but less net-long from last week. The combination of current sentiment and recent changes gives us a further mixed Gold trading bias.
| Change in | Longs | Shorts | OI |
| Daily | 11% | -8% | 3% |
| Weekly | -18% | 13% | -8% |
Charts via TradingView
For all economic data releases and events see the WH Alliance
Are you risk-on or risk-off? You can let us know via the form at the end of this piece or contact the author via Twitter @nickcawley1 .

