Dow Jones 30, Nasdaq 100, CAC 40 Analysis and Charts
Dow drifts lower
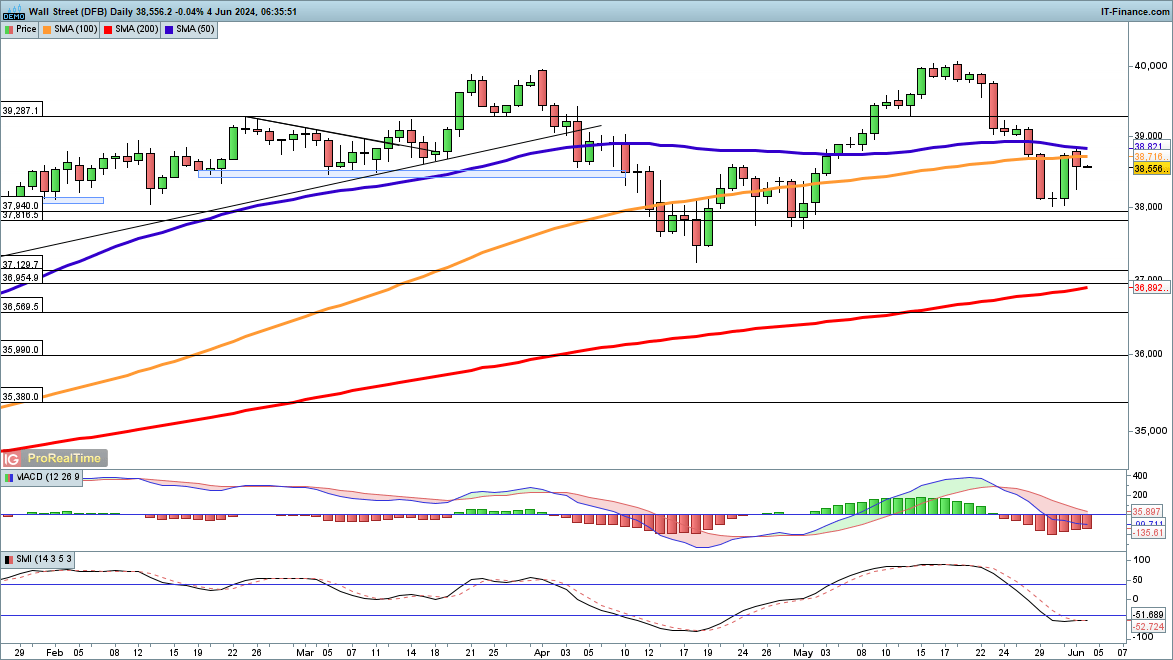
The index rebounded sharply on Friday, but suffered a wobble on Monday, though it did finish well off the lows.The situation remains finely poised; sellers might drive the price back to, and then below, 38,000, reinforcing the short-term bearish view.
Should the price close above the 50-day simple moving average (SMA), which held back gains yesterday, then a new move higher toward 40,000 may begin.
Dow Jones Daily Chart
Nasdaq 100 firmly off recent lows
Both Friday and Monday saw the price rally off the lows, helping to sustain the bullish view. A reversal back below the March highs would be needed to put a dent in this view. However, the longer-term bullish view remains in place.
Additional gains would target the recent record highs around 18,900, with 19,000 lying just beyond it.
Nasdaq 100 Daily Chart
CAC 40 rally fizzles out
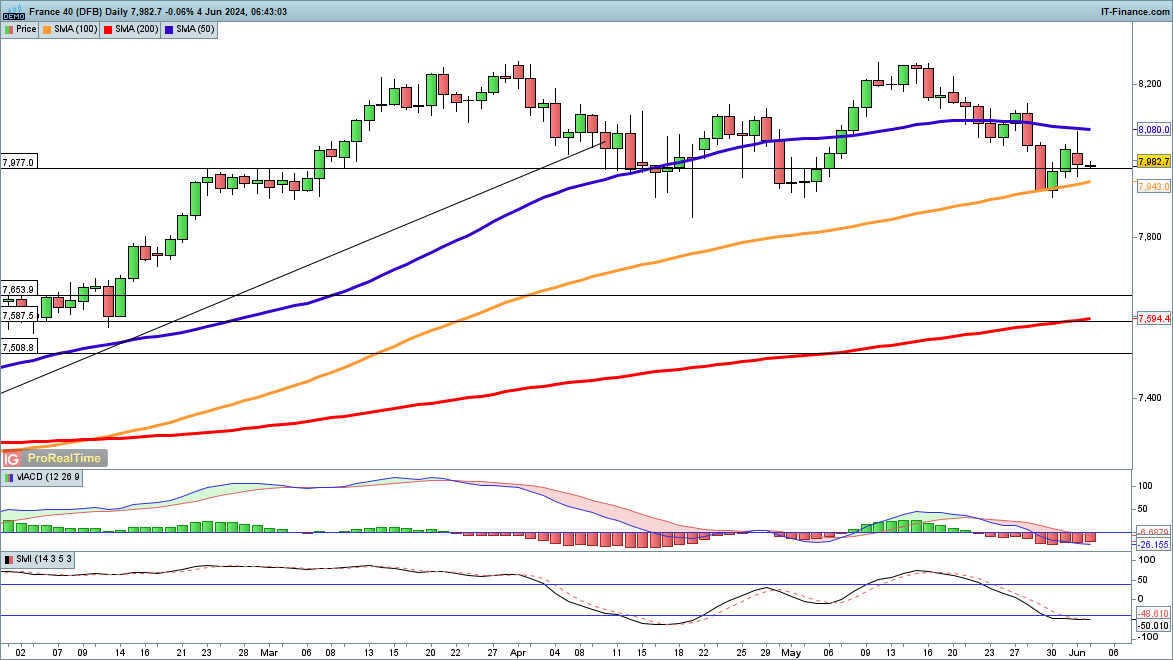
Hopes of a sustained rebound were dashed on Monday, as the price rallied towards and then fell back from the 50-day SMA.
The price finds itself back below 8,000, and the lows of April and May around 7900 are close by. A close below 7850 would suggest a much deeper pullback could be in play, perhaps targeting the 200-day SMA, last tested back in January.
CAC 40 Daily Chart