Market Overview: S&P 500 Emini Futures
The S&P 500 Emini bulls need follow-through buying to increase the odds of retesting the all-time high. If the market trades higher, the bears want a double top bear flag with the December 26 high or a lower high major trend reversal.
S&P 500 Emini Futures
The Weekly S&P 500 Emini Chart

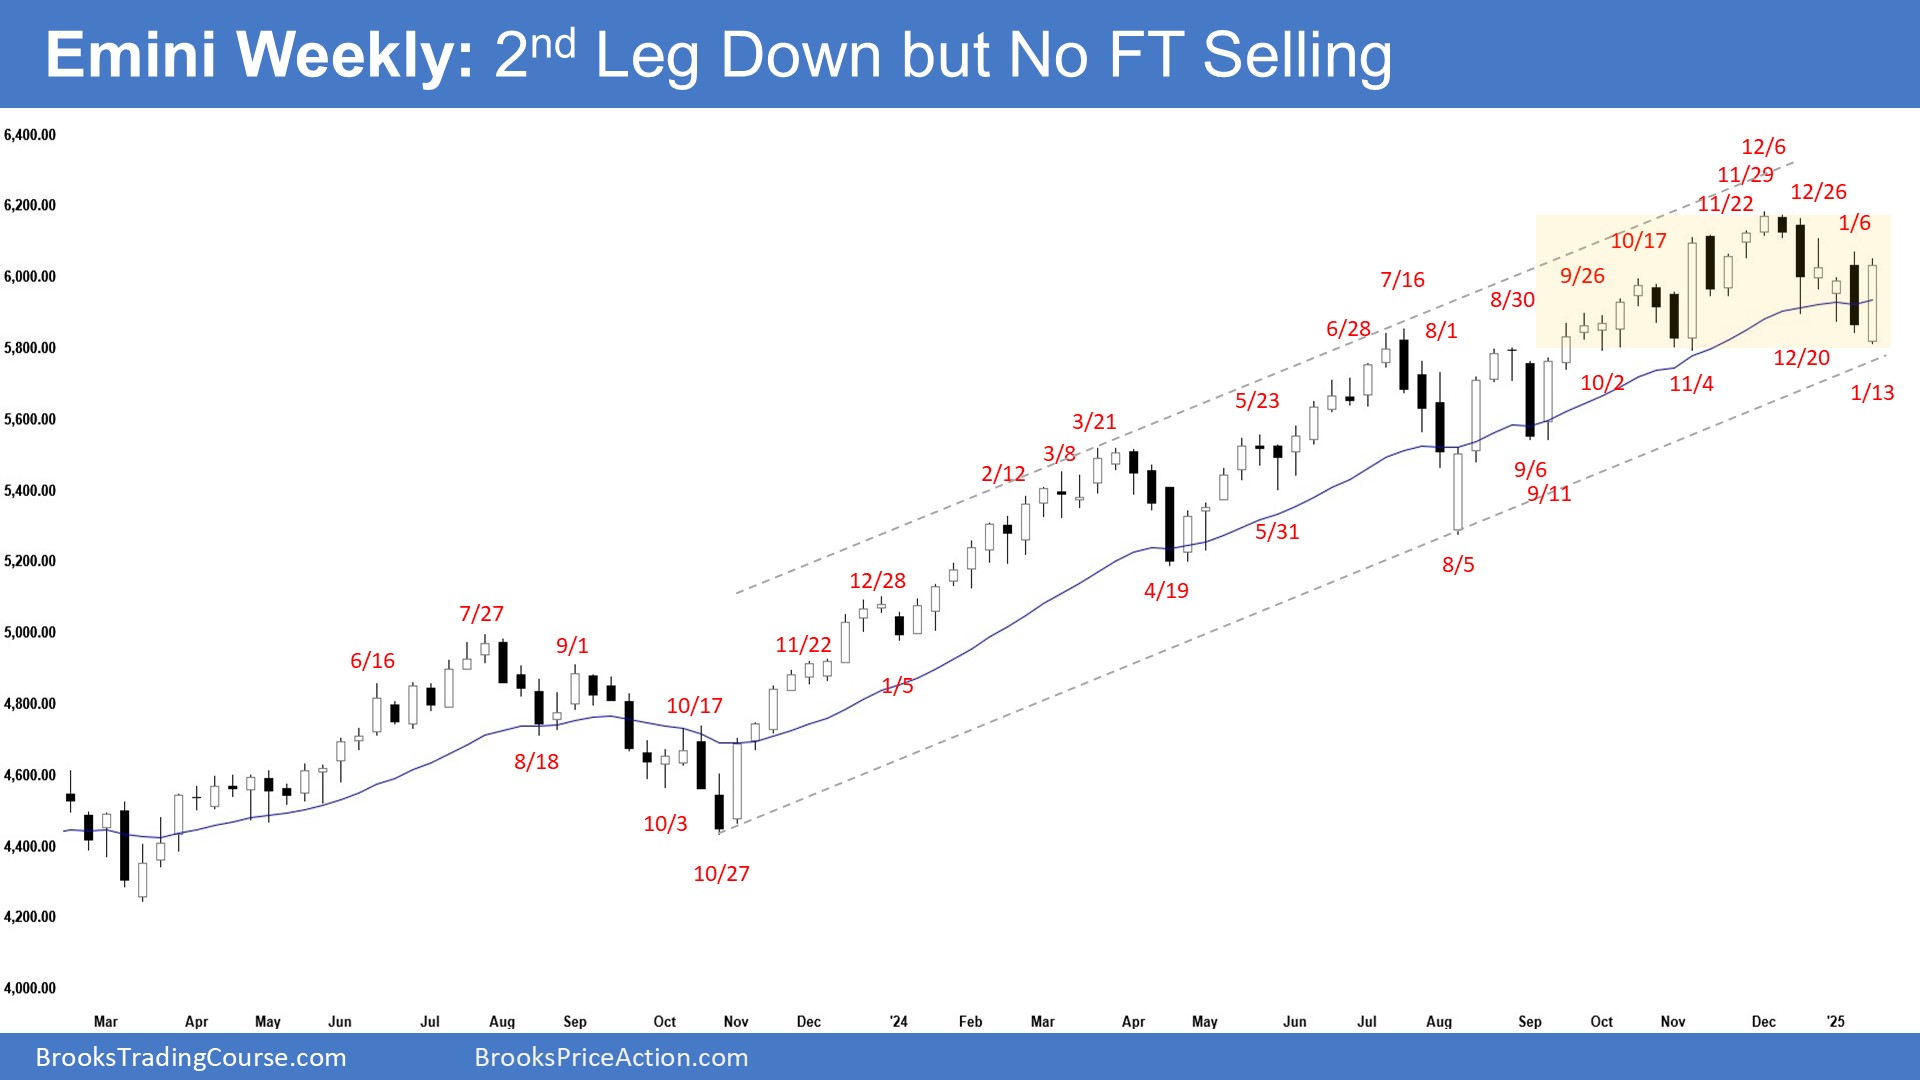
- This week’s Emini candlestick was a big bull bar closing near its high.
- Last week, we said that the market may still trade slightly lower towards the October/November lows or the bull trend line area. Traders would see if the bears could create a follow-through bear bar or if the market would trade slightly lower but close with a long tail below or a bull body instead.
- The market opened lower but reversed to close as a big bull bar.
- The bears got a two-legged pullback from a large wedge (Mar 21, Jul 16, and Dec 6), an embedded wedge (Aug 30, Oct 17, and Dec 6) and a micro wedge (Nov 22, Nov 29, and Dec 6).
- They wanted a strong second leg sideways to down but were not able to create a follow-through bear bar trading below the 20-week EMA. The bears are not yet as strong as they hoped to be.
- If the market trades higher, they want a double top bear flag with the December 26 high or a lower high major trend reversal.
- They must create consecutive bear bars closing near their lows to convince traders that they are back in control.
- The bulls see the market as being in a broad bull channel and want the market to continue sideways to up for months.
- They see the current move as a two-legged pullback and want the market to resume higher from a double bottom bull flag (Nov 4 and Jan 13).
- They hope the pullback will have poor follow-through selling. So far, this is the case.
- They want the 20-week EMA, the October/November lows, or the bull trend line to act as support.
- Since this week’s candlestick is a big bull bar closing near its high, it is a buy signal bar for next week.
- Because the weekly candlestick closed near its high, the market may gap up on Tuesday. Small gaps usually close early.
- The market may trade at least a little higher.
- Traders will see if the bulls can create a follow-through bull bar. If they do, the odds of a retest of the all-time high will increase.
- Or will the market trade slightly higher but close with a long tail or a bear body instead?
- The bears need to do more and create sustained follow-through selling to convince traders that they are back in control. They have not yet been able to do so.
- If the pullback remains sideways and shallow (overlapping candlesticks, with bull bars, doji(s), and candlesticks with long tails below), the odds of a bull trend resumption will increase after that.
- For now, odds slightly favor the pullback to be minor and not lead to a reversal.
The Daily S&P 500 Emini Chart

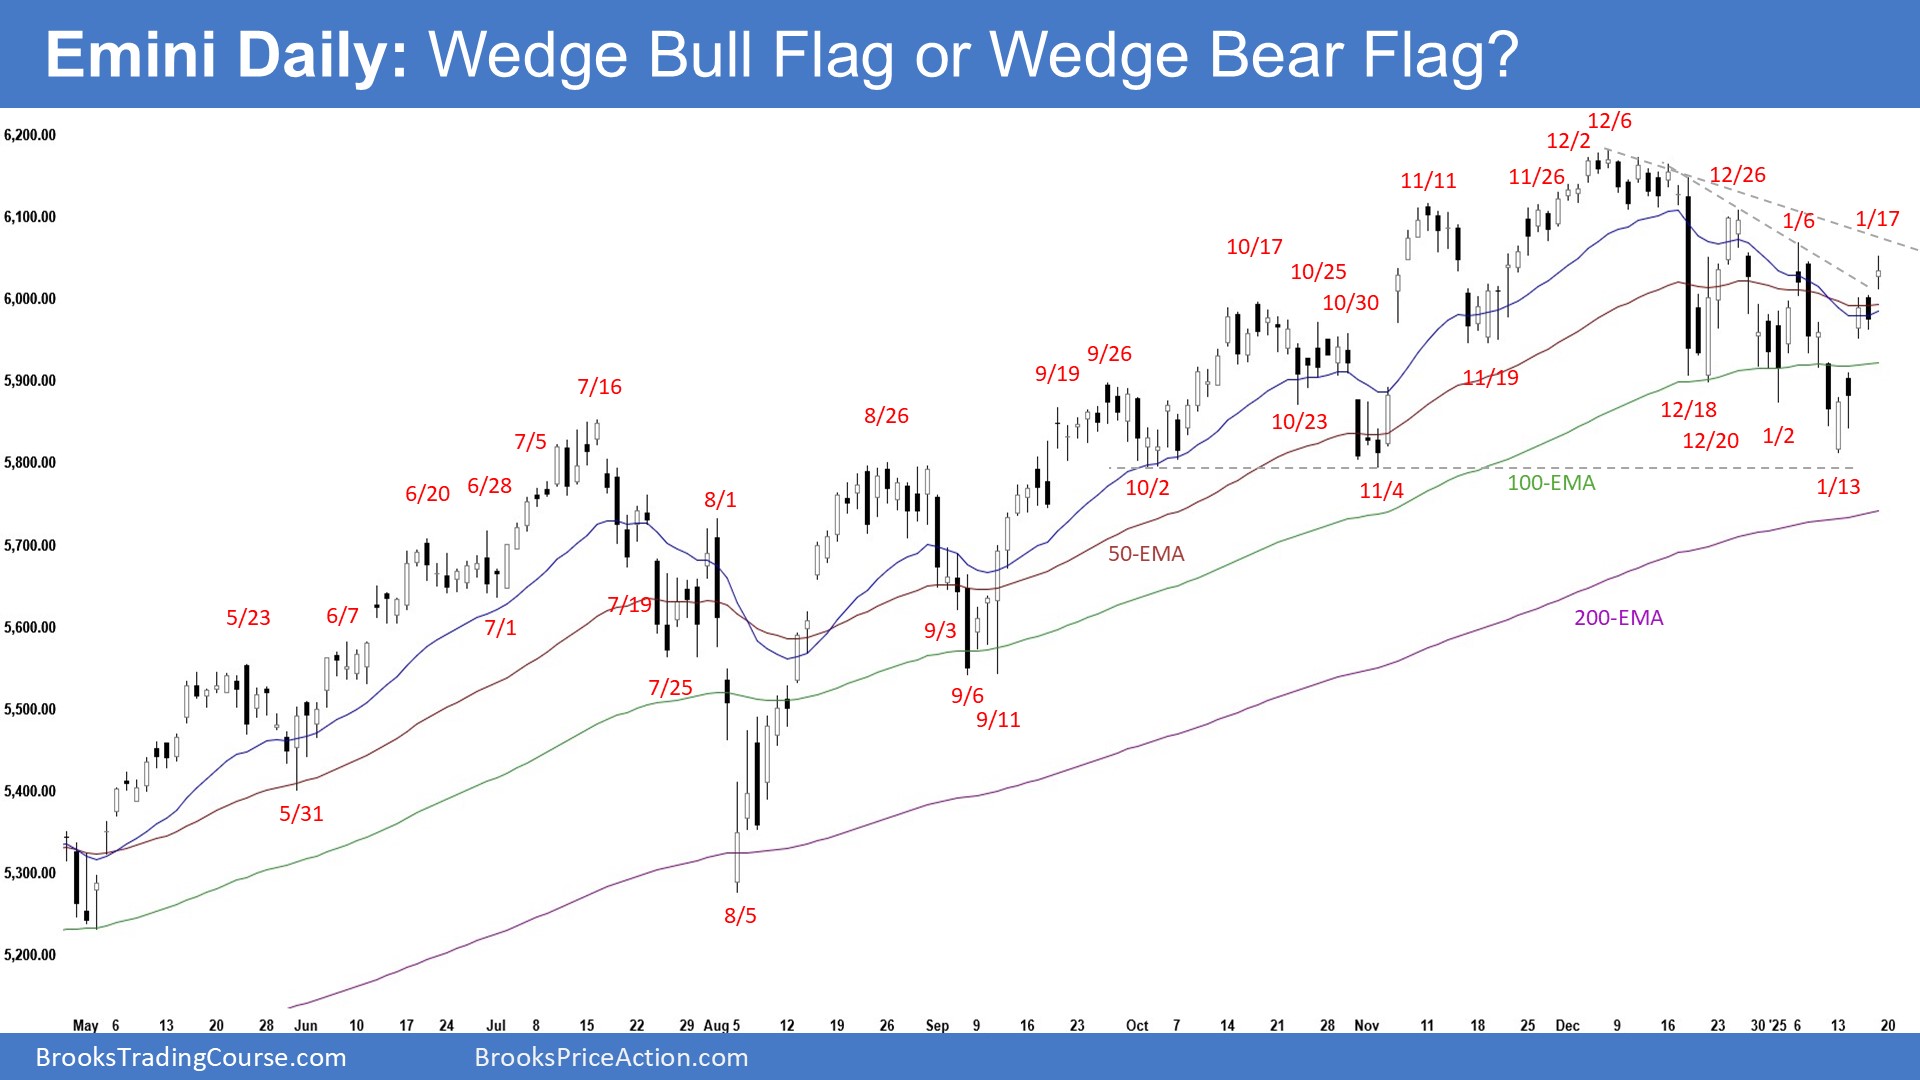
- The market opened lower on Monday but closed as a bull bar. The market then traded sideways to up for the rest of the week. Friday gapped up and closed as a bull doji with prominent tails.
- Last week, we said that the market may still trade at least a little lower. Traders would see if the bears could create follow-through selling or if the bulls would be able to create a reversal from a wedge bull flag instead.
- The bears were not able to create sustained follow-through selling this week.
- They got a reversal from a large wedge pattern (Mar 21, Jul 16, and Dec 6) and an embedded wedge (Aug 30, Oct 17, and Dec 6).
- They want a TBTL (ten bars, two legs) pullback. The pullback has fulfilled the minimum requirements.
- They want another strong leg down to test the October/November lows and the 200-day EMA from a wedge bear flag (Dec 26, Jan 6, and Jan 17).
- They want the 20-day EMA or the bear trend line to act as resistance.
- If the market trades higher, they want a lower high major trend reversal and a double top.
- The bulls see the market trading in a broad bull channel and want the move to continue for months. They want an endless pullback bull trend.
- They want a retest of the all-time high (Dec 6) from a wedge bull flag (Dec 20, Jan 2, and Jan 13) and a double bottom bull flag (Nov 4 and Jan 13).
- They want the October/November lows or the 200-day EMA to act as support.
- So far, the market has transitioned into a trading range.
- The bears need to create follow-through selling trading far below the 200-day EMA to show that they are back in control. So far, they have not yet been able to do that.
- For now, the market may trade slightly higher early next week.
- Traders will see if the bulls can create follow-through buying breaking far above January 6 or December 26 high.
- Or will the market trade slightly higher but stall, forming a lower high major trend reversal instead?
- For now, odds slightly favor the pullback to be minor and not lead to a reversal.

