Market Overview: S&P 500 Emini Futures
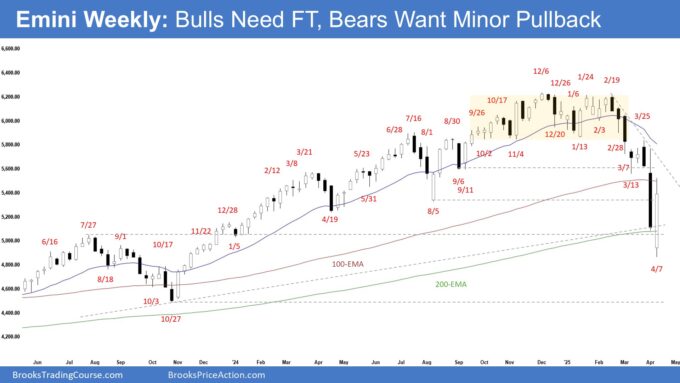
The S&P 500 Emini bulls need strong follow-through buying following to increase the odds of testing the 20-week EMA. The bears want the pullback to be weak and sideways. They want it to stall below the March 25 high, forming a large double-top bear flag.
S&P 500 Emini Futures
The Weekly S&P 500 Emini Chart

- This week’s Emini candlestick was a big bull bar closing in its upper half with a prominent tail above.
- Last week, we said the market could still trade at least a little lower. If there is a (very) big gap down at the open, it could be a climactic type of price action and bears may use that as an opportunity to take profits.
- The market gapped down at the open but lacked sustained follow-through selling. The market traded with volatile swings and closed the week above the 200-day EMA.
- The bulls hope the July 27 high, the bull trend line, or the 200-week EMA will act as support.
- They see the current move forming a major higher low.
- They hope the gap down this week will end the current leg and want it to reverse back above the 200-week EMA. They got what they wanted.
- They want a strong pullback to retest the 20-week EMA or the March 25 high.
- They must create follow-through buying next week to increase the odds of higher prices.
- The bears got a large 2-legged selloff testing the 200-week EMA.
- They have a tight bear channel, which means strong bears.
- They want the third leg down completing the wedge pattern after a pullback (the first two legs being the Mar 13 and Apr 4 lows).
- They want the pullback to be weak and sideways (overlapping candlesticks, doji(s), bear bars, and long tails above candlesticks).
- If the market trades higher, they want it to stall below the March 25 high, forming a large double-top bear flag.
- They want the 100-week EMA, the bear trend line or the 20-week EMA to act as resistance.
- While the market may still be Always In Short, the selloff was slightly climactic and oversold.
- The market may still be in the sideways to up pullback phase for next week.
- Traders will see if the bulls can create strong follow-through buying. That will increase the odds of retesting near the 20-week EMA or March 25 high.
- Or will the attempt to market trade sideways to up but lack strong follow-through buying instead?
- For now, the odds slightly favor at least a small sideways to down leg to retest the April 7 low after the pullback, even if it only forms a higher low.
The Daily S&P 500 Emini Chart

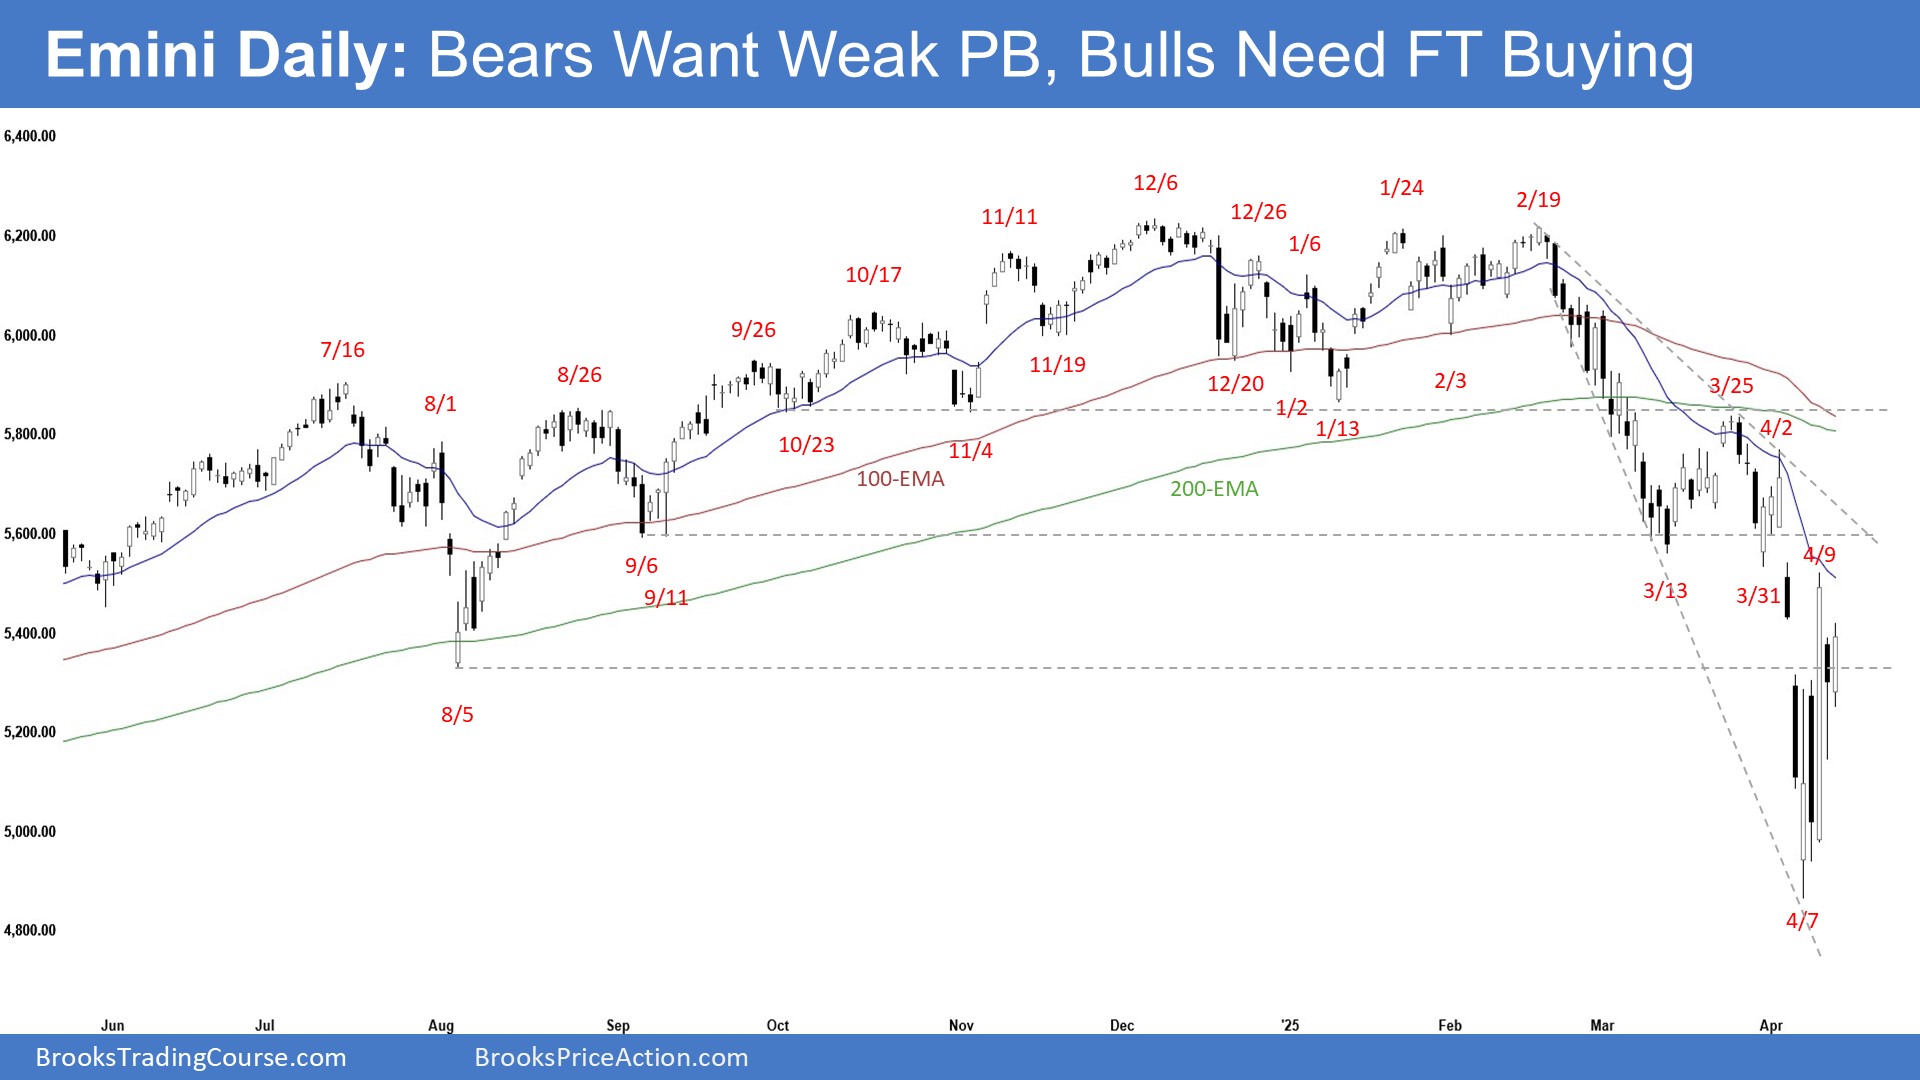
- The market gapped down on Monday but lacked sustained follow-through selling. The market then traded sideways to up to retest the 20-day EMA on Wednesday. The market formed a pullback and traded sideways on Thursday and Friday.
- Previously, we said the market remains in the sideways to down phase. Traders would see if the bears could create strong follow-through selling breaking below the March 13 low, or if the market would stall around the March 13 low area instead.
- The bulls want a reversal from a climactic selloff.
- At the least, they want a TBTL (Ten Bars, Two Legs) pullback and the market to reverse above the 20-day EMA.
- They want a retest of the March 25 high and the 200-day EMA.
- They need to create consecutive bull bars closing near their highs to show they are back in control.
- They want any pullback to be weak and sideways, lacking follow-through selling (overlapping candlesticks, bull bars, doji(s), and long tails below candlesticks).
- The bears got a large 2-legged selloff by more than 20%. The bears are strong.
- They see the current move as a pullback following a climactic selloff.
- They want the market to form a lower high and a double top bear flag with the March 25 high.
- They hope the 20-day EMA, the bear trend line, or the March 25 high will act as resistance.
- They want the pullback to be weak, lacking sustained follow-through buying (overlapping candlesticks, bear bars, doji(s), long tails above candlesticks).
- So far, the market is forming a pullback following a climactic selloff.
- The market could still be in the sideways to up pullback phase.
- Traders will see if the bulls can create strong bull bars breaking far above the 20-day EMA and the bear trend line.
- Or will the pullback lack strong follow-through buying, setting up a larger double top bear flag with the March 25 high instead?
- The selloff is strong enough for traders to expect at least a small sideways to down leg to retest the April 7 low after the pullback, even if it only forms a higher low.

