Using a Strong Trend on the Daily Chart to Dertermine the Pair We Will Trade.
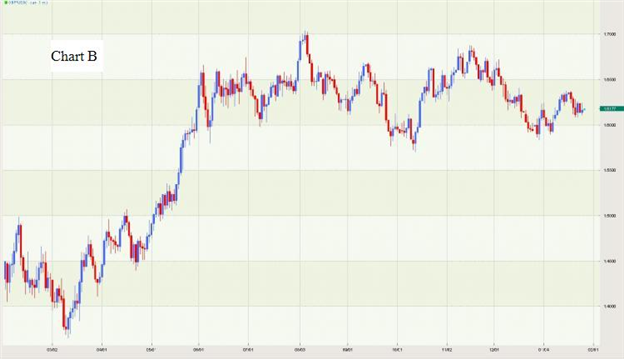
So what exactly does a strong trend look like?
So what exactly does a strong trend look like?
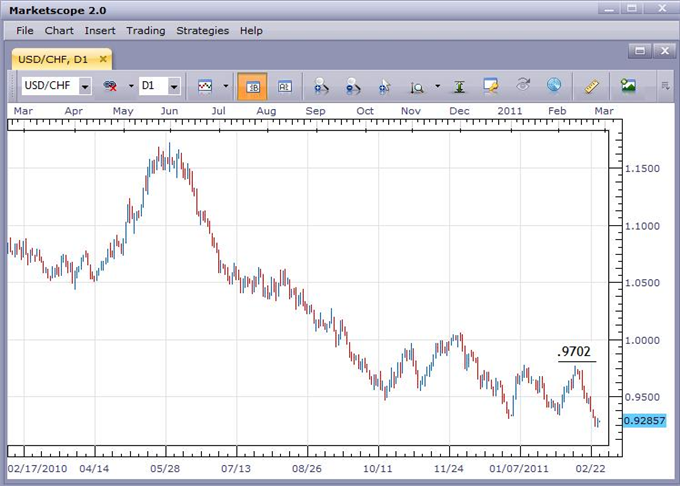
Once again, the USD/CHF printed an all-time low.
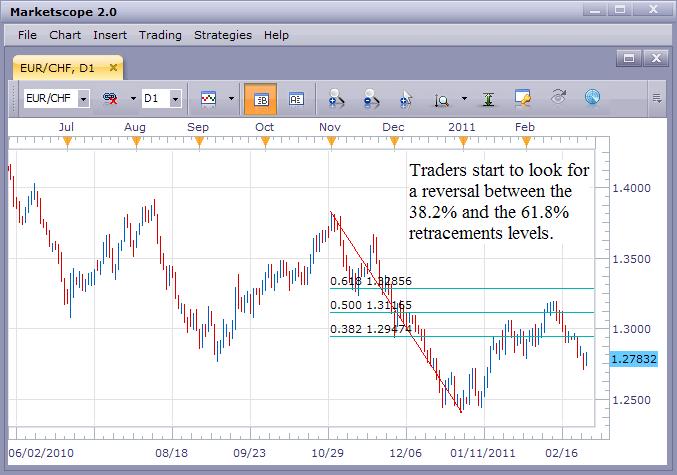
Identifying and using support and resistance for entries and exits is a solid approach. Fibonacci retracements are one way to potentially identify those levels.
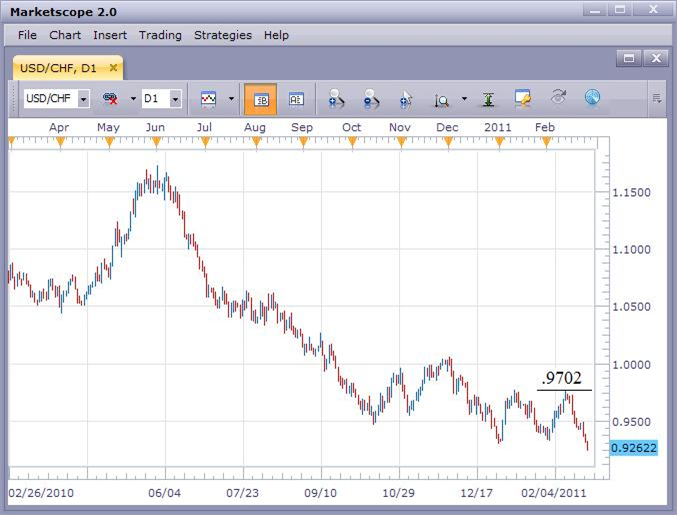
Another flight to safety by traders and another new all-time low for the USD/CHF.
Exactly what kind of trading information does the Doji provide?
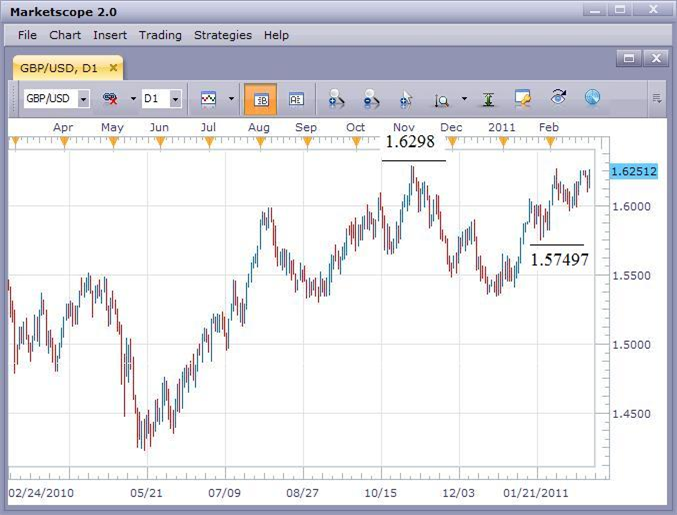
The GBP/USD appears poised to move up to test the 1.6300 level.
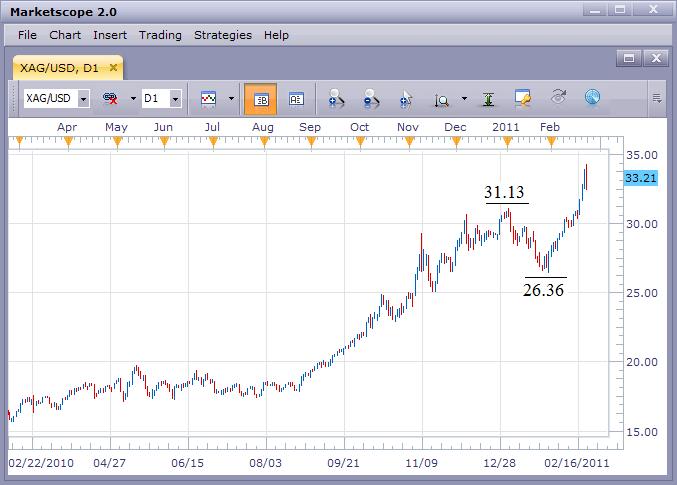
Traders seeking relative safety have turned to the silver market.
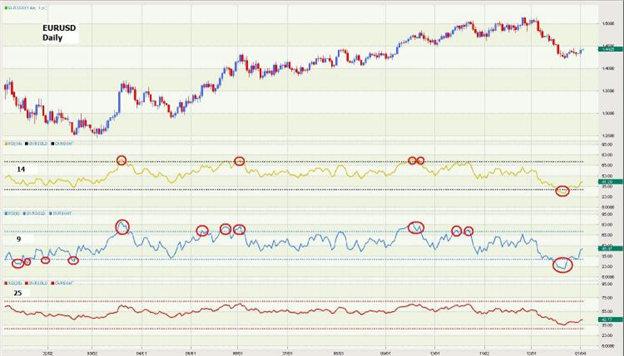
What affect do the various settings have on the sensitivity of the indicator?
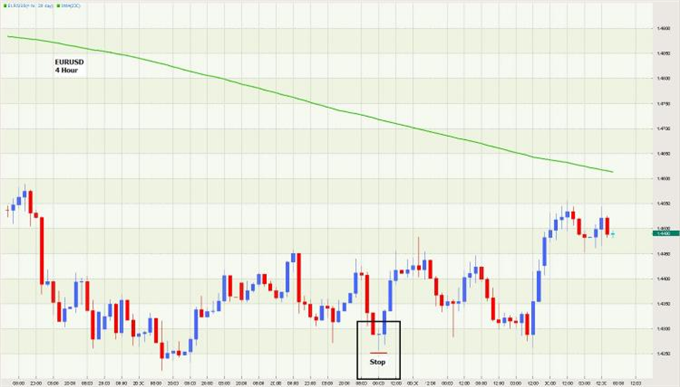
Looking at several chart time frames on a pair permits a more in depth trade analysis.
When there is a lack of clear strong trends, look trading opportunities on the pairs that tend to range.