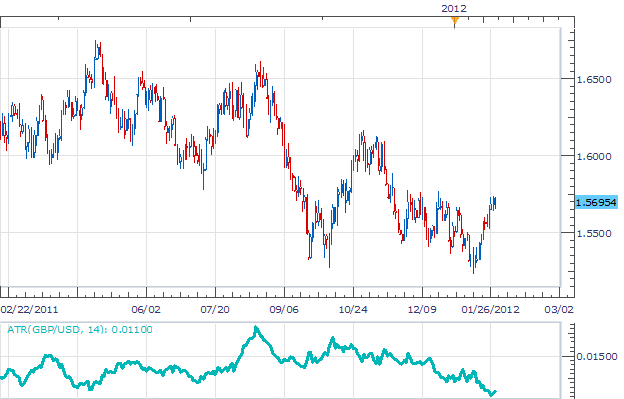
Like the majority of US Dollar pairs, the GBP/USD has been making advances in the open of the 2012 trading year. The pair is retracing a decline of 1209 pips, from the July 2010 high printed at 1.6617 to its current January 2012 low at 1.5408. With the trend at a standstill, traders may look to a developing inside bar to enter in on the next breakout for the pair.
Zooming in on Friday and Mondays price action (1D Chart) we can see the development of an inside bar. As described in a previous Chart Of The Day article, an inside bar occurs when today's price action does not exceed the previous day's high or low. Price action from Friday printed a daily high of 1.5740 and a low of 1.5640. Today's action has so far yielded a daily high at 1.5733 and a low of 1.5633, both inside our previous candles levels.
Breakout traders can use entry orders to trade a break of either the previous high or low. Expectations are that price will break and continue forming either a new high or low past this point. ATR again will be the indicator of choice for setting profit targets on our position. Current ATR for the GBP / USD resides at 110 pips. 20% of this value, or 22 pips, will be our suggested limit.
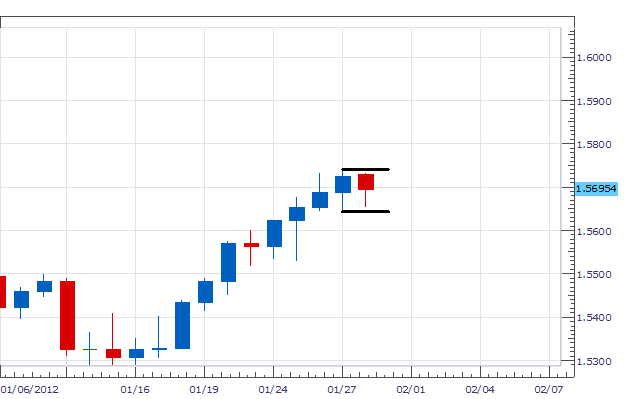
My preference is to place entries on the GBP/USD near the January 19rd high/low. Both stop/limits will look for 22 pips for a clear 1:1 Risk/ Reward ratio.
Alternative scenarios include continuing to trade “inside”, prior to a breakout.
---Written by Walker England, Trading Instructor
To contact Walker, email [email protected] . Follow me on Twitter at @WEnglandFX.
To be added to Walker's e-mail distribution list, send an email with the subject line “Distribution List” to [email protected].
provides forex news on the economic reports and political events that influence the currency market. Learn currency trading with a free practice account and charts from FXCM.