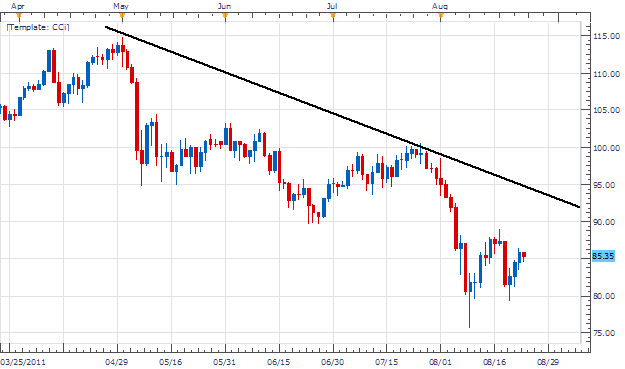
USOIL, (WTI) is currently selling off from its May 3RD high of $114.80, ending nearly a year of price increases. Four months of steady declines, has temporarily reversed that trend and brought USOIL to its August low of $75.68 for a current decline of over 34%. At present price is consolidating in a wedge pattern offering us chances to enter the commodity with a continued downward bias.
Fundamentally demand for oil has continued to decrease due to a continuing global economic slowdown. As production of goods slows as consumption wanes, less oil is needed for their creation. Libya is also a hot news topic, with pundits suggesting global oil supply may increase soon with an end of the conflict. Both factors ultimately suggest our current down trend is to continue.
Price Action
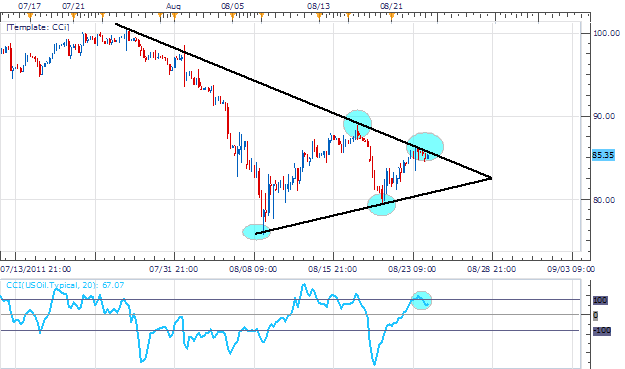
Taking price in to a 4Hour chart we can best see a wedge shape pattern forming. Previously resistance was tested on August 17th high at $88.96 and support at $79.35, the August 19th low. Current pricing is again testing resistance at $85.33. The CCI Oscillator is a great way to enter trades on retracements against the trend using overbought and oversold levels. At the close of our previous bar, CCI has returned from overbought levels signaling a resumption of the trend.
Trading O pportunity
My preference is to sell USOil using our CCI overbought signal. Entrys should be placed near support at 85.33. Stops should be placed above our previous high at $89.00 or better. Limits will target a minimum decline of $7.33 a barrel to $78.00 for a clear 1:2 risk reward setting.
Alternative scenarios include price continuing to range in our wedge prior to a breakout.
Walker England contributes to the Instructor Trading Tips articles. To receive more timely notifications on his reports, email [email protected] to be added to the distribution list.