Key Takeaways
During another volatile day of trading on Tuesday, the question likely on most investors' minds was: "When will this end?"
The S&P 500 fell as much as 1.5% on Tuesday after President Trump said he was doubling tariffs on Canadian steel and aluminum exports, escalating a trade war that threatens to splinter supply chains across the continent. Stocks rebounded Tuesday afternoon after the threat was walked back to trade slightly higher but remained more than 8% off their record high from three weeks ago.
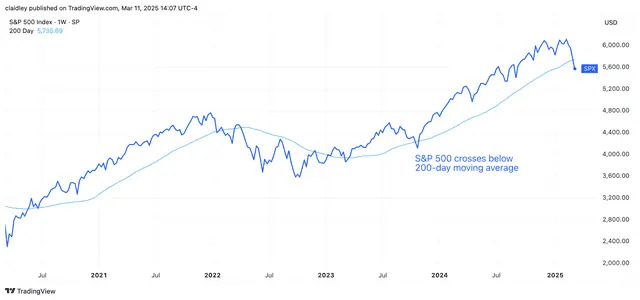
S&P 500 Falls Below 'Key Technical Indicator'
Technical analysts recently have sounded the alarm about indexes crossing below their 200-day moving averages , which Larry Tentarelli, chief technical strategist for Blue Chip Daily Trend Report, called in a note on Sunday “a key technical indicator for many large institutions.”
Tentarelli quoted hedge fund manager Paul Tudor Jones as saying, “My metric for everything I look at is the 200-day moving average of closing prices… The whole trick in investing is: ‘How do I keep from losing everything?’ If you use the 200-day moving average rule, then you get out. You play defense, and you get out.”
Tentarelli’s warning about the 200-day moving average came in response to the Nasdaq 100 closing below that threshold on Friday. He said it was just the fourth time in seven years that the index crossed below its 200-day moving average. The most recent occurrence, in March 2023, was brief, but the prior three since 2017 involved an average drawdown of about 18%, according to Tentarelli.
The S&P 500 dropped below its 200-day moving average on Monday for the first time since October 2023. That was also a short-lived dip. Still, Tentarelli suggested that investors “proceed much more cautiously” with the Nasdaq 100 and S&P 500 until the indexes return to their 200-day moving average.
S&P 500 at 5,500 an 'Attractive Risk/Reward Setup,' Says Citi
Citibank analysts were more optimistic about the near-term outlook. They called the S&P 500 at 5,500—just 0.5% below the S&P 500’s trough on Tuesday—“an attractive risk/reward setup relative to our current 6,500 base case" in a Monday research note.
The Citi analysts noted that, despite tariff uncertainty, the S&P 500 is expected to see solid free cash flow this year. They acknowledge that the “magnitude and sustainability” of flows are uncertain but that large firms are nonetheless on track for “good financial flexibility this year.”
Citi analysts expect Trump’s nearshoring efforts to boost capital spending in the long run as S&P 500 companies increase their investment in domestic manufacturing. But in the near term, economic and policy uncertainty is likely to lead firms to reduce their capital expenditure plans, potentially freeing up cash to put toward other uses, including stock buybacks .
“Should large-cap U.S. equities continue to correct, we expect that share repurchase activity would increase, thus providing some level of support to stock prices,” the analysts wrote.
Accelerated buybacks could be supportive of stock prices in the long term, too.
“Ongoing ‘de-equitization’ of the S&P 500 also aligns with a favorable longer-term supply versus demand setup," the analysts wrote.
Read the original article on Investopedia